Product categories
|
Reporting periods
|
||
|---|---|---|---|
| Name | Pillar | Earliest data | Latest data |
| Conventional Occupational Pension Plans | Occupational (II) | 2000 | 2024 |
| Mostly Bonds Pension Plans | Voluntary (III) | 2000 | 2024 |
| Mostly Equity Pension Plans | Voluntary (III) | 2000 | 2024 |
| Equity Pension Plans | Voluntary (III) | 2000 | 2024 |
Resumen
El sector de las pensiones complementarias en España sigue teniendo un tamaño limitado. Incluyendo los instrumentos de ahorro a largo plazo que no son formalmente planes de pensión, como los seguros de vida, sus activos solo representan el equivalente al 21 % del PIB español. Los ciudadanos españoles, al igual que muchos europeos (occidentales), siguen disfrutando de prestaciones de la Seguridad Social que sustituyen a más del 80 % del último salario, y las inversiones inmobiliarias —«ladrillo y cemento»— siguen considerándose en gran medida como la mejor inversión que puede realizar un hogar, incluso (o especialmente) para la jubilación. En consecuencia, las pensiones complementarias en España siguen siendo, en relación con el tamaño del país y su economía, esencialmente un asunto de pequeña escala, lo que se ve agravado por la fragmentación del ahorro a largo plazo y de jubilación en una amplia y variada gama de productos financieros, tanto de empleo como personales: los españoles tienen muchas cuentas de ahorro para la jubilación, pero poco dinero en cada uno de ellas. Además, la aversión al riesgo generalizada (aunque en declive) conlleva grandes inversiones en activos de renta fija de menor rendimiento. A pesar de un año 2024 muy bueno, con una rentabilidad neta real a un año que oscila entre el +1,9 % para los planes de pensiones de “renta fija mixta” del sistema individual y el +17,1 % para los planes de “renta variable”, todo esto se traduce en un historial de rentabilidad a largo plazo decepcionante para los fondos de pensiones españoles: los planes de empleo y los planes individuales de renta variable muestran una rentabilidad neta real anualizada del 0,5 % y el 0,6 %, respectivamente, en los últimos 25 años, mientras que los planes individuales de renta fija mixta y renta variable mixta muestran una rentabilidad negativa, tras costes e inflación, del -1,4 % y el -0,7 %, respectivamente, en el mismo periodo. El Gobierno parece decidido a poner orden en el sector de las pensiones complementarias, con una reforma y mayores incentivos fiscales para los fondos de pensiones de empleo, al tiempo que recorta el apoyo fiscal al ahorro en planes de pensiones individuales. Queda por ver qué efectos tendrá esto en la rentabilidad de las pensiones complementarias españolas.
Summary
The Spanish supplementary pensions sector remains limited in size. Even including long-term savings vehicles that are not formally retirement-purpose investments, like life insurance, its assets only represent the equivalent of 21% of the Spanish gross domestic product (GDP). Spanish citizens, like many (Western) Europeans, still enjoy Social Security pension benefits that replace over 80% of the last salary, and real estate investments—“brick and mortar”—are still largely considered as the best investment a household can make, even (or especially) for retirement. Supplementary pensions in Spain remain as a result, in relation to the size of the country and its economy, essentially a small-scale affair, which is further compounded by the fragmentation of long-term and pension savings into a wide and varied array of financial products, both occupational and personal: Spaniards have many different pots of pension savings, but little money in each of those. Furthermore, widespread (though declining) risk aversion entails large investments into lower-yield fixed income assets. Despite a very good year 2024, with 1-year real net performance ranging from +1.9% for the most conservative individual “mostly bonds” pension plans to +17.1% for individual “equity” plans, all this translates into a disappointing long-term performance track record for Spanish pension funds: occupational pension plans and individual “equity” plans show an annualised real net return of 0.5% and 0.6%, respectively, over the past 25 years, while individual “mostly bonds” and “mostly equity” plans show a negative return after cost and inflation of -1.4% and -0.7%, respectively, over the same period. The government seems keen on putting the supplementary pensions’ house in order, with a reform of and increased tax incentives for occupational pension funds, while cutting fiscal support for savings into individual pension plans. What effects this will have on the cost-efficiency of Spanish supplementary pensions remains to be seen.
17.1 Introduction: The Spanish pension system
The Spanish population is one of the fastest ageing population across the European Union (EU). Like many Europeans, Spaniards rely mostly on benefits from the pay-as-you-go (PAYG) public pensions managed by the Instituto Nacional del Seguro Social (INSS), the national social security agency, which, like most public, Pillar I pensions across the continent, is under increasing strain due to the growing ratio of retirees to working population.
In the wake of the euro and sovereign debt crisis, which particularly affected Spain in the years 2011-2013, the country enacted a wave of reforms of the public pension system with the aim to ensure its long-term financial sustainability. These reforms, however, were found to have a disproportionate negative effect on the pension benefits that younger generations of Spanish workers might expect. Considering how the country’s other economic challenges—inter alia housing prices (Pérez 2026), youth unemployment (Statista 2025)—particularly affect younger generations, several major new reforms were enacted since 2020 that complement and partly reverse, the orientation of the 2011-2013 reforms. In a sense, Spain constitutes a typical case in our study, with its ageing population, public pensions under strain and underdeveloped occupational and personal supplementary pensions. Nevertheless, what may set Spain apart from the other countries in this report, is that the recent reforms of both the public and supplementary pensions seem to show the government’s faith in the capacity of public pensions to overcome the strain from the ageing population while maintaining high ambitions in terms of intergenerational solidarity and redistribution. Whether these reforms are likely to succeed is the subject of heated debates in Spain, and a matter of great interest for the rest of Europe.
In this chapter, we have decided to offer the reader a comprehensive overview of the Spanish pension system, including convention pension plans and insured pension products. However, due to data limitations, our analysis of real net performance is limited to conventional pension plans: performance data for insured pensions are not available. As shown in Table 17.1, we compute real net returns for four categories of conventional pension plans from 2000 to end-2024: occupational pension plans, first, that belong to Pillar II of the pension system; and three categories of individual pension plans in Pillar III, which differ from each other with regard to the allocation of assets into equity vs. bonds. Data used for this analysis are extracted primarily from annual reports from INVERCO, the trade association of investment and pension funds (INVERCO 2025 and previous editions) as well as from the Dirección General de Seguros y Fondos de Pensiones (DGSFP), the department of the Spanish Ministry of the Economy in charge of insurance and pension funds (Dirección General de Seguros y Fondos de Pensiones 2025 and previous years).
The computed real net returns of these four categories of products is presented in details in the penultimate section of this chapter (Section 17.5). Table 17.2 already provides an overview of the situation of Spanish private pensions over the long term: The good performance of capital markets in 2023 was passed on unequally to Spanish pension savers, with the real net performance of equity pension plans over the past year reaching 17.% close to three times that of mostly equity pension plans, the second best performance in Pillar III. This higher performance of equity Pillar III plans can be observed for periods up to 10 years in the past; however, the 25-year return of these plans is largely disappointing, broadly in line with that of the three other categories.
Holding period
|
|||||||
|---|---|---|---|---|---|---|---|
| 1 year | 3 years | 5 years | 7 years | 10 years | Whole reporting period | to... | |
| Conventional Occupational Pension Plans | 4.6% | -2.0% | -0.5% | 0.1% | 0.7% | 0.5% | end 2024 |
| Mostly Bonds Pension Plans | 1.9% | -3.4% | -2.5% | -1.9% | -1.3% | -1.4% | end 2024 |
| Mostly Equity Pension Plans | 5.9% | -1.7% | -0.1% | 0.3% | 0.9% | -0.7% | end 2024 |
| Equity Pension Plans | 17.1% | 3.3% | 5.7% | 5.3% | 5.3% | 0.6% | end 2024 |
| Data: INVERCO, DGFSP, Eurostat; Calculations: BETTER FINANCE | |||||||
Pension system in Spain: An overview
The Spanish pension system, considered in the narrow sense of schemes dedicated to providing pension income, is a classic three-pillar system, with a large Pillar I, PAYG public pension scheme—pension benefits paid by INSS replace 80.4% of the average salary 1—complemented by more limited and mostly voluntary occupational and personal funded pension schemes (Pillar II and III) managed by pension funds and life insurance companies (Dirección General de Seguros y Fondos de Pensiones 2025, 226).To get a more accurate view of Spaniard’s retirement savings, however, one should also keep in mind the large amounts that they invest in other financial vehicles and, importantly, in real estate.
Pillar I
Amongst the measures enacted since 2021 features the indexation of public pensions on inflation: For the year 2026, the government thus announced an increase of 2.7% of social security pensions from their amount on December 31st, 2025, with a maximum monthly benefit set at EUR 3359.60.
The Factor de Sostenabilidad (FS)—or “sustainability factor”—was a correction factor introduced as part of the 2011-2013 reforms to account for changes in life expectancy. It was first suspended then definitely discarded by the 2021 reform of public pensions—due to its alleged disproportionate impact on younger generations—and was replaced by the Mecanismo de Equidad Intergeneracional (MEI)—which can translate as “intergenerational fairness mechanism”.2 This temporary mechanism seeks to diffuse the impact of population ageing—in particular the retirement of the “baby boom” generation—by front-loading today part of the social contributions that are to fund public pension liabilities from 2050, thus distributing the financial effort across generations of Spanish workers. As the Spanish legislator puts it:
An automatic mechanism for cutting the initial amount of pensions, the sustainability factor, is being replaced by an instrument that responds to a diametrically different logic and which, instead of condemning younger people to more modest pensions, guarantees that the system we know today will be maintained in the coming decades through the recovery of the Reserve Fund. (Jefatura del Estado 2023)
Concretely, the MEI consists in a temporary mandatory increase in social contributions from companies and employees, initially for a duration of ten years—from 2023 to 2032—subsequently extended to 2050 by the 2023 reform (Jefatura del Estado 2023). Initially set at 0.60%, the extra contribution was raised to 1.2% by the 2023 reform, of which 1% borne by the employer and 0.2% by the employee. The produce of this extra contribution is meant to feed into the Fondo de Reserva de la Seguridad Social (social security reserve fund), for a total amount that the Spanish government initially expected to reach EUR 50 millions by the end of 2032.3 From 2033 on, every three years, the forecast of expenditures for 2050 will be reassessed: if the new forecast surpasses the initial forecast, the INSS will be able to tap into the reserve fund. The 2023 law rewrites Art. 121 of the general law on social security (Ley General de la Seguridad Social), setting variable annual limits to the amounts that can be drawn from the fund: the maximum drawdown starts at 0.10% of the Spanish GDP in 2033, increases incrementally to a maximum of 0.91% of GDP in 2047, before receding to 0.50% by 2053.
With a view to increase revenues for the public pension system, the 2023 reform enacted by the Real Decreto-ley 2/2023—titled “urgent measures to extend pensioners’ rights, reduce the gender gap and establish a new framework for the sustainability of the public pension system”—introduced an incremental increase of the contribution rate
The 2023 reform also created an “additional solidarity contribution” on high salaries, which does not grant any additional pension benefits. The contribution applies progressively: On the part of the salary comprised between the maximum normal contribution rate and that maximum normal contribution rate plus 10%, the solidarity contribution is set at 5.5%, 6% on the part of the salary comprised between the maximum rate plus 10% and the maximum rate plus 50%, and 7% beyond the maximum normal contribution rate plus 50%.
In parallel, The Real Decreto-ley 13/2022 reformed the social contribution system for the self-employed, introducing a new mechanism to calculate contributions, which entered into force on January 1st, 2023, with a transition period of 10 years. The reform sought to address the lack of revenues of the social security regime for the self-employed, rooted, according to the legislator, in the choice of too many self-employed to contribute only the minimum rate instead of contributing in relation to their actual revenues. The reform then creates a scale of contribution rates proportional to the economic revenues from self-employed’s activities (Jefatura del Estado 2022b).
To these measures, the 2021-2025 reforms add new measures designed to maintain older workers in employment until or even beyond the retirement age. The 2021 reform thus included measures to bring the effective retirement age closer to the statutory retirement age by, inter alia, making the calculation of anticipated pension benefits less advantageous while providing incentives, in the form of a bonus, to postpone retirement; it also banned forced retirement before the age of 68. The 2025 reform further reduced the amounts of partial pension benefits that those in situation of jubilación activa—workers having passed the statutory retirement age but without a complete work career (36.5 years of contributions, in 2025)—can receive. By contrast, for workers who delay their retirement (jubilación demorada), the additional benefit is now calculated for each quarter worked beyond retirement age instead of each year.
But the Spanish reforms of public pensions are not all about increasing revenues and postponing retirement. They also introduced several important measures to revalue the lowest pensions so that they remain at least equal to the poverty line, to revalue widow’s pensions and, importantly to reduce the gender pension gap that results, usually for women, from caring for children. In 2025, the Decreto-ley 402/2025 also introduced criteria to authorise early retirement in professions considered as dangerous due to a higher mortality rate or higher risk of suffering from occupational disease.
Pillar II
Pillar II, the sector of employer-sponsored retirement savings plans, was in Spain historically limited in its coverage and accumulated assets. As already mentioned, Social Security old-age benefits in Spain replace pre-retirement wages with one of the highest rates in the world and against a rather high pay-roll tax mostly paid by employers.4 So, there is little margin left for occupational and individual retirement accounts to step substantially into the retirement arena. Indeed, what we observe in Spain is a very limited landscape for marketed retirement solutions even though the modern regulation for these products was enacted around 1987.
There are three main types of retirement vehicles that employers may offer to their employees: Planes de Pensiones de Empleo (PPEs), Seguros Collectivos (SCs) and Planes de Previsión Social Empresarial (PPSEs).5 These plans all are capitalisation retirement accounts, of either Defined benefits (DB) or Defined contributions (DC) type, to which employers contribute a percentage of employees’ wages. Workers can also contribute. According to the DGSFP, there were at the end of 2024 over 12 million accounts open within these three types of occupational plans, for total assets under management (AuM) of above EUR 64 billion. Even though the sector is growing—with a 8.29% increase in number of participants in 2024, and contributions in excess of benefit payments by EUR 509 millions—the accrued amounts per participant remain low, with an average of EUR 5175 across the whole Pillar II, receding from 5423 at the end of 2023 (Dirección General de Seguros y Fondos de Pensiones 2025, 229).
The Spanish government enacted a reform of PPEs in June 2022 to promote these occupational pension plans and extend their coverage amongst Small and Medium-sized Entreprises (SMEs), public employees, self-employed and temporary workers. The government thus decided to enable the creation of “simplified” occupational pension plans (planes de empleo simplificados) with simpler and faster administrative processing, with a view to facilitating the offer of occupational pensions by smaller enterprises, at a lower cost. The reform also entailed the creation of 15 Fondos de Pensiones de Empleo de Promoción Pública (FPEPPs)—collectively nicknamed the “macrofondo”—where existing and newly created DC PPEs and Planes de Pensiones de Empleo Simplificados (PPESs) could be integrated, with the goal of benefitting from economies of scale and reducing management costs—with fees comprised between 0.1% and 0.25% of AuM per annuum. As the Spanish legislator explains:
one of the main objectives of this law is to promote the existence of publicly promoted occupational pension funds of sufficient size to ensure lower management costs, allow for diversified investment distribution and, thereby, improve profitability levels, bringing them in line with those of other collective investment institutions.
Ley 12/2022 (Jefatura del Estado 2022a).
The 15 FPEPPs were created in December 2023: five “management entities” were selected through public competition by the Comisión Promotora y de Seguimiento (Promotion and Monitoring Committee), in charge of defining the standards and criteria to be met by the management of the FPEPPs and a common investment strategy which is to take into account financial return and risk but also the social and environmental impact of the investments made by the funds. A Comisión de Control Especial (“Special Control Committee”) is furthermore tasked with the supervision of these funds.
In parallel, the 2022 Budget law increased the tax deductibility of contributions to occupational pensions from EUR 8500 to EUR 10 000, a stark contrast with the situation of Pillar III, individual pension plans which clearly shows in what direction Spain intends to develop its pension system in the coming decades.
Pillar III
Individual supplementary pensions of the third Pillar include Planes de Pensiones Personales (PPPs), Planes de Previsión Asegurados (PPAs), Planes de Previsión Social (MPSs) and Seguros de Dependencia (SDs). By end 2024, Pillar III pension plans altogether had 8.3 million accounts open, for a total of EUR 113.8 billion under management. Albeit higher than in Pillar II, accrued amounts per participant remain rather low at EUR 13 623 on average (EUR 36 480 in MPSs). Like most Pillar II plans, these Pillar III plans are voluntary, but their are “personal” in the sense that each individual can choose their own plan amongst those on offer on the market. One salient feature within this category is that contributions by participants are delayed until the end of the year using balances left in their income-expenditure flows at that point in time to profit from tax deductibility.
Contributions to Pillar III pension schemes have been falling quickly after the 2021 budget law—Ley 11/2020 de Presupuestos Generales del Estado par el año 2021—reduced the ceiling of tax deductibility of contributions from EUR 8000 in 2020 to EUR 2000 per year in 2021, doubling down with a further reduction to EUR 1500 in the 2022 budget law. Contributions to Pillar III plans fell to EUR 2841 millions in 2024, down 10.78% from the previous year and a cumulated 44% decrease since their end-2020 level at EUR 5106 millions. Of all types of Pillar III instruments, PPPs are the most affected by the measure, with a 57% fall in contributions from 2020 to 2024. While this development constitutes a testament to the power of tax levers to incentivise retirement savings, it also raises an important question: was tax deductibility the only argument Spanish personal pension had going in their favour or were they so poorly marketed by financial advisors that Spanish citizens could not see their other merits? We shall return to this question in Section 17.5.1.
17.2 Long-term and pension savings vehicles in Spain
Even if, due in part to the high replacement rate of the public pension, the role played by Pillars II and III supplementary pensions is not a very large one in Spain, there is a significant variety of marketed retirement products. The most standard retirement vehicles, as said above, are pension plans (PPEs in Pillar II and PPP in Pillar III) and pension insurance (particularly SCs in the occupational realm). Most retirement vehicles in Pillar III are provided by financial institutions and insurers that also act as managers and depositories of Pillar II occupational pension plans, which are sponsored by employers. Also, several professional associations have since long created MPSs (welfare mutual funds) that offer complementary (mostly Pillar III) coverage to mutualistas (members), with some of those mutual funds also operating as regulated alternative schemes to social security schemes for the self-employed (Pillar I).
Pillar II and III pension schemes were introduced in Spain in the years 1987–1988. Occupational pensions, which used to be managed and provided directly by employing firms where progressively transfered to newly created pension funds (fondos de pensiones), entities with a legal personality distinct from that of employing firms and whose mission was to provide pension plans (planes de pensiones). The Spanish Parliament passed in 2022 law 12/2022, which reforms occupational pension funds with the creation of public occupational pension funds and “simplified occupational pension plans”, extending the coverage of occupational pensions in Spain to civil servants and self-employed workers, two categories that had until then been excluded from Pillar II.
Personal pension products come in a variety of shapes in Spain, as can be seen from Table 17.3. Pensions funds and insurance companies both offer occupational and personal pension savings products. We note that, while pension funds have more participants, the lion’s share of retirement savings is managed by insurance companies; this makes all the more regretable that cost and performance data is not available for insurance-based pension products in Spain. There is also a noticeable imbalance between occupational pensions and personal pensions, the latter having many more participants and much larger amounts under management than the former, despite the generally higher fees of personal pension products (see Section 17.3).
| AuM (EUR mln.) | Participants (thousands) | Avg. savings per participant (EUR) | |
|---|---|---|---|
| Pension funds1 | 131 832.76 | 10 193.31 | 12 933.26 |
| Pillar II | 38 818.50 | 2 832.41 | 13 705.10 |
| Occupational pension plans | 38 818.50 | 2 832.41 | 13 705.10 |
| Pillar III | 93 014.25 | 7 360.90 | 12 636.26 |
| Individual pension plans | 92 242.36 | 7 311.53 | 12 616.00 |
| Associated pension plans2 | 771.89 | 49.37 | 15 636.38 |
| Insurance-based pension vehicles3 | 211 313.80 | 8 964.18 | 23 573.13 |
| Pillar II | 34 626.87 | 1 207.20 | 28 683.69 |
| Company Social Welfare Plans | 450.10 | 41.79 | 10 770.46 |
| Pension commitment instrumentations | 25 905.71 | 757.51 | 34 198.32 |
| Other collective life insurance | 8 271.06 | 407.89 | 20 277.53 |
| Pillar III | 176 686.94 | 7 756.98 | 22 777.79 |
| Insurance pension plans | 10 118.82 | 686.37 | 14 742.56 |
| Deferred capital | 46 805.01 | 2 133.90 | 21 934.04 |
| Annuities | 76 073.34 | 1 703.31 | 44 662.09 |
| PIAS4 | 15 710.99 | 1 481.76 | 10 602.93 |
| SIALP5 | 3 567.22 | 297.57 | 11 987.89 |
| Unit-linked life insurance | 24 411.56 | 1 454.08 | 16 788.33 |
| Total | 343 146.56 | 19 157.49 | 17 911.87 |
| Pillar II | 73 445.37 | 4 039.61 | 18 181.30 |
| Pillar III | 269 701.19 | 15 117.88 | 17 839.88 |
| 1 Data as of December, 31st 2024 | |||
| 2 Retirement savings vehicles sponsored by labour associations and regulated as Pillar III products. | |||
| 3 Data as of September 30th, 2025 | |||
| 4 Plan Individual de Ahorro Sistemático (Systematic Individual Savings Plans) | |||
| 5 Seguro Individual de Ahorro a Largo Plazo (Long Term Individual Savings Insurance) | |||
| Data: INVERCO, UNESPA; Calculations: BETTER FINANCE. | |||
Pension plans
Pension Plans (planes de Pensiones) are the standard retirement saving vehicles in Spain, albeit only one of many different retirement vehicles that are currently being marketed in the country. They can be promoted by employers on behalf of their employees, by professional associations on behalf of their members or by financial institutions for the general public (workers included).6
Pension Plans are voluntary and complementary to Social Security pensions. Their benefits are not integrated in any way with Social Security benefits. Plans created after 1987 legislation are DC plans, but many previously existing occupational plans that had to be later segregated from their parent companies and transferred to Pension Funds continue to be DB plans, accounting for roughly half the volume (but decreasing) of assets managed into the occupational subclass.
Pension plans fall into three categories (or “systems”, as they are known in Spain):
- Sistema de empleo: Employer-sponsored pension plans, they are the standard form of pension fund-based occupational pensions in Spain (in the remainder of this chapter, we will use the terms “employer-sponsored” and “occupational” interchangeably);
- Sistema asociado: A small and fading type of plans sponsored by labour associations, which are not occupational in the sense that there is usually no contribution from the employer;
- Sistema individual: Personal pension plans, which individuals can freely subscribe and contribute to on their own.
As the reader can appreciate from Table 17.4, in terms of number of accounts, the only “system” that has increased in the past decade and a half has been that of employer-sponsored plans, with over 30% more participants on December 31st, 2024 than on December 31st, 2010: after decreasing steadily for over a decade, the number of accounts started picking up quickly from 2022. “Associate” plans, in the meantime, lost over a third of their members. “Individual” plans, while losing over one million participants, still remain by far the largest of the three systems.
Dec. 2010
|
Dec. 2024
|
Change 2010—2024 | |||
|---|---|---|---|---|---|
| Accounts | % total | Accounts | % total | ||
| Employer sponsored | 2 149 334 | 19.8% | 2 832 414 | 27.8% | 31.8% |
| Associate | 78 072 | 0.7% | 49 365 | 0.5% | -36.8% |
| Individual | 8 601 775 | 79.4% | 7 311 535 | 71.7% | -15.0% |
| Total | 10 829 181 | 100.0% | 10 193 314 | 100.0% | -5.9% |
| Data: INVERCO. | |||||
Correspondingly, as Table 17.5 shows, the number of pension plans has shown an almost regular decrease throughout the present decade. The number of plans totalled 2964 in 2010 and 2274 at the end of 2023, a fairly regularly distributed 23.3% decrease though time, averaging over sub-schemes, most relevant again (in absolute terms) for the individual plans sub-scheme. This overall reduction in the number of plans aligns with a concentration trend observed within the same order of magnitude in other European countries: considering the continued growth of assets, this implies an increase in the size of the average plan, which may translate into economies of scale.
| Employer sponsored | Associated | Individual | Total | |
|---|---|---|---|---|
| 2010 | 1 484 | 209 | 1 271 | 2 964 |
| 2011 | 1 442 | 198 | 1 342 | 2 982 |
| 2012 | 1 398 | 191 | 1 385 | 2 974 |
| 2013 | 1 350 | 187 | 1 384 | 2 921 |
| 2014 | 1 330 | 178 | 1 320 | 2 828 |
| 2015 | 1 312 | 172 | 1 257 | 2 741 |
| 2016 | 1 305 | 164 | 1 189 | 2 658 |
| 2017 | 1 291 | 156 | 1 109 | 2 556 |
| 2018 | 1 293 | 151 | 1 075 | 2 519 |
| 2019 | 1 284 | 146 | 1 036 | 2 457 |
| 2020 | 1 282 | 141 | 976 | 2 399 |
| 2021 | 1 286 | 136 | 903 | 2 325 |
| 2022 | 1 295 | 131 | 856 | 2 282 |
| 2023 | 1 335 | 124 | 823 | 2 282 |
| 2024 | 1 354 | 109 | 811 | 2 274 |
| Change 2010--2024 | -8.8% | -47.8% | -36.2% | -23.3% |
| Data: INVERCO. | ||||
Employer-sponsored pension plans represented, as of December 31st, 2024 27.8% of all pension funds accounts (Table 17.4) but close to 60% of the number of plans (Table 17.5). In terms of number of accounts, then, the average employer-sponsored pension plan is much smaller (2092 accounts) than its individual counterpart (9015 accounts), a dispersion that may limit economies of scale in Pillar II without further consolidation. The gap in average savings between employer-sponsored plans and individual plans has also been closing fast, with the average savings in sistema de empleo falling from EUR 18 656 per account in 2021 to EUR 13 753 on December 31st, 2024, less than a thousand euros above the average amount in individual pension plans (EUR 12 854). The increase in the number of employer-sponsored accounts in recent years accounts for much of this reduction in average savings in Pillar II, as these new participants are only starting their accumulation phase.
Employer sponsored
|
Associated
|
Individual
|
Total
|
||||
|---|---|---|---|---|---|---|---|
| AuM (EUR mln.) | % of total | AuM (EUR mln.) | % of total | AuM (EUR mln.) | % of total | AuM (EUR mln.) | |
| 2010 | 31 272 | 36.9% | 926 | 1.1% | 52 552 | 62.0% | 84 750 |
| 2011 | 31 170 | 37.5% | 835 | 1.0% | 51 142 | 61.5% | 83 148 |
| 2012 | 32 572 | 37.6% | 795 | 0.9% | 53 160 | 61.4% | 86 528 |
| 2013 | 33 815 | 36.5% | 1 001 | 1.1% | 57 954 | 62.5% | 92 770 |
| 2014 | 35 262 | 35.1% | 940 | 0.9% | 64 254 | 64.0% | 100 457 |
| 2015 | 35 548 | 34.0% | 958 | 0.9% | 68 012 | 65.1% | 104 518 |
| 2016 | 35 437 | 33.2% | 921 | 0.9% | 70 487 | 66.0% | 106 845 |
| 2017 | 35 683 | 32.2% | 903 | 0.8% | 74 378 | 67.0% | 110 963 |
| 2018 | 33 810 | 31.6% | 829 | 0.8% | 72 247 | 67.6% | 106 886 |
| 2019 | 35 710 | 31.0% | 859 | 0.7% | 79 850 | 69.4% | 115 035 |
| 2020 | 35 681 | 30.5% | 827 | 0.7% | 82 014 | 70.1% | 117 027 |
| 2021 | 37 792 | 29.9% | 883 | 0.7% | 89 323 | 70.8% | 126 246 |
| 2022 | 34 634 | 30.4% | 779 | 0.7% | 78 579 | 68.9% | 113 994 |
| 2023 | 36 670 | 30.0% | 792 | 0.6% | 84 923 | 69.4% | 122 385 |
| 2024 | 38 819 | 29.4% | 772 | 0.6% | 92 242 | 70.0% | 131 833 |
| Data: INVERCO. | |||||||
Pension Plans integrate for the sake of management and by law into Pension Funds (Fondos de Pensiones) to reach scale and financial synergy. This is the case of small Pillar II, occupational plans and of virtually all Pillar III, or individual retirement plans and associated plans. Pension Funds are legal entities, linked or not to financial institutions, obliged by law to contract out their managing and depositary functions with specialized, licensed agents.
2024 was a second positive year in a row for pension fund savers, with a net yield of over EUR 10 billion, which takes the end-of-year value of pension funds’ overall AuM to a new high, with over EUR 131 billion, completing pension funds’ recovery from the 2022 slump (see Table 17.7). Net investments (i.e., the balance between contributions and payouts) remain negative for the fourth year in a row, albeit by a much smaller margin: they “only” contracted by EUR 615 million in 2024, down from EUR 1133 million in 2023. This is in part due to the stabilization of contributions into individual pension plans—which had been falling dramatically in 2021 and 2022—and in part due to contributions into occupational pension plans picking up (EUR +314 million).
| BoY assets | Net investments | Net yields | EoY assets | |
|---|---|---|---|---|
| 2012 | 83 148 | 70 | 3 310 | 86 528 |
| 2013 | 86 528 | 239 | 6 003 | 92 770 |
| 2014 | 92 770 | 898 | 6 789 | 100 457 |
| 2015 | 100 457 | 526 | 3 535 | 104 518 |
| 2016 | 104 518 | 264 | 2 063 | 106 845 |
| 2017 | 106 845 | 451 | 3 667 | 110 963 |
| 2018 | 110 963 | −170 | −3 907 | 106 886 |
| 2019 | 106 886 | 799 | 8 734 | 116 419 |
| 2020 | 116 419 | 1 176 | 928 | 118 523 |
| 2021 | 118 523 | −305 | 9 745 | 127 998 |
| 2022 | 127 998 | −928 | −13 076 | 113 994 |
| 2023 | 113 994 | −1 133 | 9 524 | 122 385 |
| 2024 | 122 385 | −615 | 10 063 | 131 833 |
| Data: INVERCO; Calculations: BETTER FINANCE; BoY: Begining of Year; EoY: End of Year. | ||||
Individual pension plans typically offer a variety of risk profiles participants can chose from, depending on their risk preferences. This enables participants to switch across plans with different levels of exposure to equity markets as they advance in age, in a sort of life cycle approach. Those alternate plans range from plans with a third-party guarantee of return (sistema individual garantizado) to plans almost entirely invested in equity markets (sistema individual de renta variable). INVERCO, the trade association of Spanish investment and pension funds, classifies individual pension plans as follows:
- Garantizados (“guaranteed”): Plans that come with a minimum return guarantee offered by a third party;
- Renta fija (“fixed income”): Plans that invest fully in fixed-income securities or derivatives with fixed-income securities as underlying, with a maturity of maximum one year; this category is subdivided into renta fija a corto plazo (“short-term fixed income”, securities in the portfolio have a maturity of maximum one year) and renta fija a largo plazo (“long-term fixed income”, maturities over one year);
- Renta fija mixta (“mostly bonds”): Plans that invest at most 30% of contributions in equity;
- Renta variable mixta (“mostly equity”): Plans with 30% to 75% invested in equity;
- Renta variable (“equity”): Plans with at least 75% of assets invested in equity.
Occupational schemes, by contrast, are set with the risk profile established by their sponsors and fund managers (or control boards, where employers and workers’ representatives sit). They typically have a certain freedom to change the risk profile of the fund according to market conditions.
In this report, we will focus our analysis of costs and performance on occupational pension plans, for Pillar II, and, for Pillar III, on the three largest (per AuM) varieties of individual plans: the “mostly bonds”, “mostly equity” and “equity” pension plans. Altogether, these four categories total close to EUR 120 billion in AuM, the lion’s share of pension fund assets (see Figure 17.1).
Figure 17.2 shows the striking evolution of Spanish pension savers’ choice of plans within the sistema individual. Guaranteed (guarantizados) and bonds-only pension plans (renta fija), which together used to account for over half of all individual plans’ assets, have shrunked to a mere 16.3%. At the other extreme, full equity-based plans (renta variable) more than doubled it share of total assets. But the largest increase is that of the “mixed” categories (renta fija mixta and renta variable mixta) from 35.5% of total Pillar III assets in 2010 to 63% by the end of 2024.
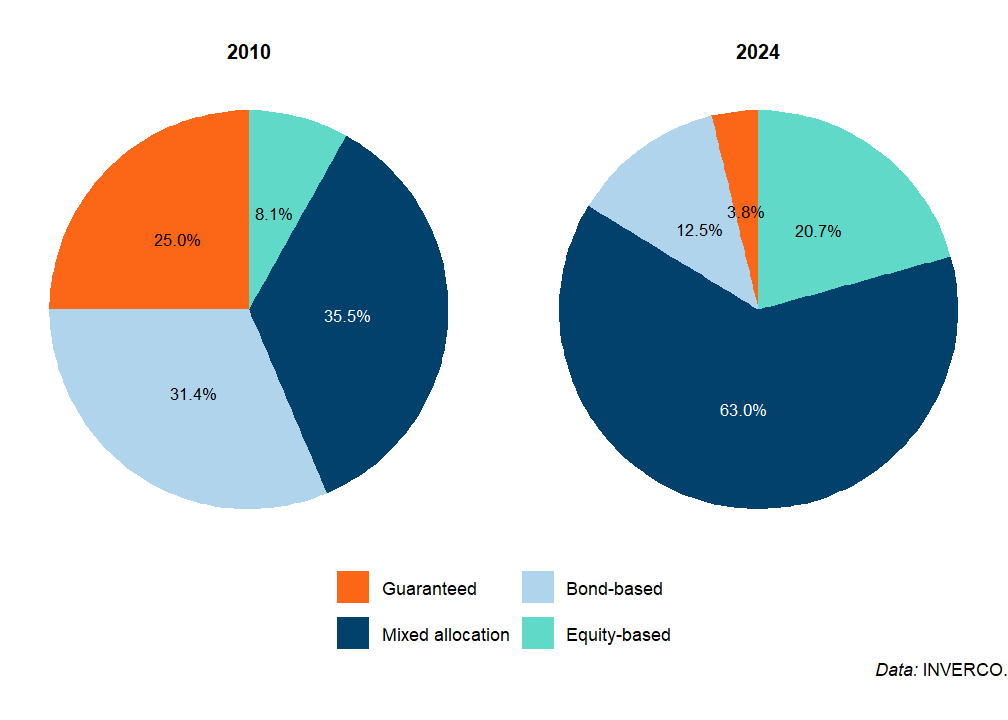
This may be indicative of a wider “search for yield” on the part of Spanish pension savers, especially as the “low-for-long” interest rate environment of the 2010s but also the continued pressure that markets and international institutions maintained over Spain’s public finances—including its public pension system—and the inevitable doubts about the adequacy of future public pensions that these pressures are sure to have triggered in many Spaniards’ minds.
Altogether, this relative less risk-averse orientation appears reflected into the broad asset allocation of the pension fund sector, which saw a decrease of the shares of corporate and, especially, government bonds, while allocation to equity and alternative asset classes increased (see Table 17.8).
The reduction of the exposure to sovereign bonds, in particular, appears structural: even though their share of total assets increased again in 2022—the year Russia invaded Ukraine, sparking capital market turmoil—the mid-term trend since 2019 clearly shows a decline, that largely benefits allocation to investment funds. The breakdown of pension funds’ investments into investment funds is, unfortunately, not disclosed by INVERCO, which prevents us to look through this item at the actual asset classes the pension funds are exposed to.
| Equity | Investment funds | Gvt. bonds | Corporate bonds | Deposits | Other | Total | |
|---|---|---|---|---|---|---|---|
| 2016 | 12.8% | 19.2% | 37.0% | 17.6% | NA | 13.4% | 100.0% |
| 2017 | 15.0% | 23.5% | 31.3% | 17.7% | NA | 12.4% | 100.0% |
| 2018 | 15.3% | 24.2% | 31.3% | 17.7% | NA | 11.4% | 100.0% |
| 2019 | 17.0% | 27.4% | 28.9% | 17.9% | NA | 8.7% | 100.0% |
| 2020 | 16.3% | 28.8% | 26.5% | 18.7% | NA | 9.6% | 100.0% |
| 2021 | 15.8% | 29.5% | 22.3% | 16.8% | 6.7% | 8.8% | 100.0% |
| 2022 | 15.8% | 26.6% | 25.1% | 16.7% | 5.8% | 10.0% | 100.0% |
| 2023 | 16.6% | 26.9% | 24.1% | 16.3% | 5.8% | 10.3% | 100.0% |
| 2024 | 18.2% | 28.8% | 22.6% | 14.8% | 4.6% | 15.5% | 100.0% |
| Data: DGSFP; Calculations: BETTER FINANCE. | |||||||
Pension Plans in Spain, like in most countries, are tax-qualified (EET) retirement vehicles (see Section 17.4). All payments by participants (or on their behalf) are tax-exempt up to a limit so that compounded interest may play its full magic over larger savings over many years. Benefits are taxed (see below). In exchange for this tax treatment, funds cannot be cashed before retirement unless some major contingencies happen (redundancy, sickness, or long-term unemployment), albeit some extra flexibility has been added recently. Accrued rights, however, can be switched by participants to different plan promoters at no cost within the individual plans scheme.
Insurance-based pension savings
Measured by its AuM, the insurance industry is a major provider of retirement income products in Spain, both for Pillar II and, especially, Pillar III. Insurers also manage a substantial part of standard Pension Funds’ assets. A salient feature of this trade is the large variety of retirement and quasi-retirement vehicles that the industry markets in Spain and everywhere.
Some of these vehicles are indistinguishable from genuine retirement or pension plans, and quite a few are genuine life insurance solutions marketed since very old times by the industry and turned into retirement vehicles through progressive assimilation with the standard vehicle (Pension Plans) firstly regulated in Spain in 1987/1988. This assimilation has been fuelled by converging fiscal treatments for all these products, even if some of them continue to have distinctive features of their own.
Market practitioners often distinguish “fund-based” from “insurance” solutions when describing the nature of a given retirement solution. Many retirement savings vehicles, even those offered by pension funds and other non-insurance undertakings, contain insurance DNA in their composition, either because they cover biometric risk to some extent or offer pay-outs in the form of annuities. Insurance-based retirement products distributed by insurance undertakings offer higher protection against capital market volatility, often in the form of a guarantee to recoup one’s capital or to reach a minimum guaranteed level of return. Thus deemed safer, these products are nevertheless also costlier for the buyer than products without guarantees.
The great diversity of risks covered and of forms the guarantees can take result in a wide and variegated array of insurance-based retirement savings products. This variety may warranted by the variety of needs of Spanish savers (or not); what is certain is that it does not make things easier for individuals looking for the right product.
According to UNESPA, the trade association representing Spanish insurers, the total technical reserves of insurance-based pension savings in Spain amounts to over EUR 211 billion at the end of 2024 (see Table 17.3), spread over 8.9 million accounts, which sets the average savings in those products at EUR 23 573.13 per account, over ten thousands euros above the average savings in pension funds. Pillar III products make up the bulk of these savings, with EUR 176.7 billion (versus “just” EUR 34 billions in insurance-based Pillar II vehicles).
Insured retirement plans (PPA)
The PPAs or “insured retirement plans”, are the insured counterpart of standard pension plans that were previously discussed. Among all insured retirement (or retirement-like) vehicles, PPAs are the most proper for this purpose. Their features concerning taxes, redeemability, or other factors are thoroughly the same as those of pension plans, but the fact is that interest and principal risks are taken by the insurer at a cost naturally. In particular, a known and certain interest rate is attached to this product. Once retirement happens, the insured person gets a life annuity (a lump-sum is also a popular option). In a way, technically, at least, a PPA is basically a pure deferred annuity. By Sept. 2025, 687 thousand PPAs were opened, for a total of EUR 10 billion, figures that have been declining substantially in recent years.
Company retirement plans (PPSE)
PPSE are employer-sponsored (Pillar II) group insurance contracts intended to provide a complementary retirement benefit, usually in the form of a deferred capital. They are the insurance-based counterpart to the sistema de empleo pension funds (occupational pension plans), but are often deemed more adapted to SMEs due to their greater flexibility. Their coverage is, however, relatively limited, with a mere 41 thousand workers enrolled in Sept. 2025 for a total of EUR 450 million in AuM.
Individual regular savings plans (PIAS)
Planes Individuales de Ahorro Sistemático (PIASs) are more flexible than conventional pension plans and PPAs. They are not, strictly speaking, pension savings products, as savings are not formally locked-in until retirement (withdrawals are allowed after only one year). Nevertheless, the design of their accumulation phase (regular contributions under a ceiling) and, even more, the tax treatment of those products clearly shows the legislator’s intention to make PIASs one of the most tax-advantaged option for pension savings (see Section 17.4.4).
Contributions are capped at EUR 8000 per year—fully deductible from the contributor’s taxable income, which makes them much more attractive than the other personal pension products. The total of contributions cannot exceed the limit of EUR 240 000 per contract (but the total principal plus capital gain can exceed that ceiling) and each Spanish resident can only own one PIAS contract.
Payout options include lump sum withdrawals and annuities, with significantly different tax treatments that clearly intend to steer savers’ choice towards annuitization (see Section 17.4.4).
Long-term individual saving plans (SIALP)
Introduced by the 2014 tax reform, Seguros Individuales de Ahorro a Largo Plazo (SIALPs) and their bank-based equivalent Cuentas Individuales de Ahorro a Largo Plazo (CIALPs) constitute what is knows as Planes de Ahorro 5 (“Savings plans 5”), after the number of years savings must remain in the plan in order to benefit from the favourable tax treatment. SIALPs are insurance-based investment products (IBIPs) similar to life insurance, whereby:
- capital can be withdrawn at any time (no lock-in, but no partial withdrawal either);
- contributions cannot exceed EUR 5000 annually;
- a guarantee to recoup at least 85% of the value of the capital at the term of the contract applies (insurers can offer guarantees up to 100% of capital);
- a guaranteed technical interest rate is applied to net contributions (i.e., amounts invested after deduction of all costs).
Like PIASs, SIALPs come with tax advantages intended to incentivise savers to leave their money on the plan for at least 5 years (see Section 17.4.5) 7.
There are two main differences with PIASs:
- The first difference is the risk profile: SIALPs, with their guarantees on capital and technical interest rates offer great stability and target savers with high risk aversion;
- The second difference is that SIALPs do not allow regular withdrawals, let alone annuitization: the capital must be withdrawn as one lump sum (which the holder could, of course, still use to buy an annuity).
17.3 Charges
Since its inception in 1987/1988, the Pension Plans market in Spain has been characterized by high average charges. There are three key aspects to consider from the outset: (i) the Spanish retirement solutions market has historically been very small, which negatively impacts scale and efficiency, (ii) Pillar II schemes offer internationally competitive low fees, but due to the limited market size, these must be subsidized by the significantly higher fees charged in Pillar III markets, and (iii) fees have been decreasing in recent years due to intense regulatory pressure on companies.
The data discussed below clearly illustrates the consequences for savers arising from current market conditions. Over the past decade, average fees have steadily decreased to around 1% of AuM. Using this figure as a proxy for total expense ratio (TER) (or total cost ratio for investors), it can be inferred that typical investors may endure a lifelong reduction in their reduction-in-yield (RiY) retirement savings—amounting to approximately 13% of their final labour life savings due to these charges.
In the insurance sector of the retirement market, there is limited knowledge regarding data that can be used for harmonized comparisons. While regulators and the industry provide relevant data in raw form, the wide variety of retirement and pension products—each with its unique features—complicates the process of producing directly comparable data. This chapter cannot cover the extensive work required to achieve that goal, but any initiative aimed at this would be greatly welcomed.
Even though regulations contribute to the additional burden of management and depositary fees for consumers, the presence of too many intermediaries—such as managers, brokers, and retailers—exacerbates the overall costs for participants or insured individuals. Recently, management and depositary fees have been regulated to prevent excessive charges. However, these regulations permit variable fees to be established based on specific yields, within certain limits.
Figure 17.3 and Table 17.9 show the evolution of effective average fees charged to plan participants by both managers and depositories on Pillars II and III Pension Funds. Note that, as said before, some distribution fees (for which data are unavailable) may also be added to management fees.
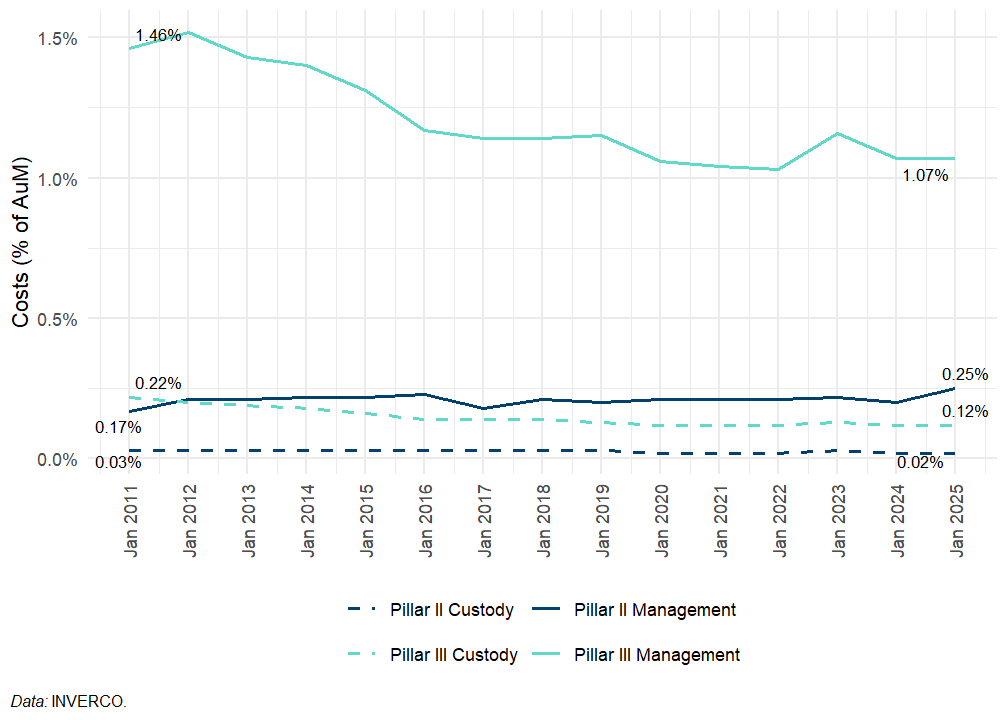
The most notable aspect of the data in the graph is that Pillar II assets, which include employer-sponsored pension plans, are significantly more cost-effective to manage—up to nearly six times less expensive in recent years. Furthermore, depositary fees, which are already relatively low in both pillars, remain five times cheaper in Pillar II compared to Pillar III. This raises the question of whether the substantial difference in fees is solely attributable to market scale (Table 17.9).
Pillar II
|
Pillar III
|
|||||
|---|---|---|---|---|---|---|
| Management | Custody | Total | Management | Custody | Total | |
| 2010 | 0.17% | 0.03% | 0.20% | 1.46% | 0.22% | 1.68% |
| 2011 | 0.21% | 0.03% | 0.24% | 1.52% | 0.20% | 1.72% |
| 2012 | 0.21% | 0.03% | 0.24% | 1.43% | 0.19% | 1.62% |
| 2013 | 0.22% | 0.03% | 0.25% | 1.40% | 0.18% | 1.58% |
| 2014 | 0.22% | 0.03% | 0.25% | 1.31% | 0.16% | 1.47% |
| 2015 | 0.23% | 0.03% | 0.26% | 1.17% | 0.14% | 1.31% |
| 2016 | 0.18% | 0.03% | 0.21% | 1.14% | 0.14% | 1.28% |
| 2017 | 0.21% | 0.03% | 0.24% | 1.14% | 0.14% | 1.28% |
| 2018 | 0.20% | 0.03% | 0.23% | 1.15% | 0.13% | 1.28% |
| 2019 | 0.21% | 0.02% | 0.23% | 1.06% | 0.12% | 1.18% |
| 2020 | 0.21% | 0.02% | 0.23% | 1.04% | 0.12% | 1.16% |
| 2021 | 0.21% | 0.02% | 0.23% | 1.03% | 0.12% | 1.15% |
| 2022 | 0.22% | 0.03% | 0.25% | 1.16% | 0.13% | 1.29% |
| 2023 | 0.20% | 0.02% | 0.22% | 1.07% | 0.12% | 1.19% |
| 2024 | 0.25% | 0.02% | 0.27% | 1.07% | 0.12% | 1.19% |
| Data: INVERCO. | ||||||
In this context, industry transparency requirements at the international scale are starting to provide a framework for generating a comprehensive understanding and common ground for comparison about the cost and advantages of complementary retirement vehicles, as these solutions become increasingly necessary to help cushion the hard landing of Social Security benefits everywhere.
All Pillar III vehicle providers are obliged to advance a Key Information Document (KID) to their customers. These KIDs are firmly rooted in the PRIIPs regulation, which is not binding for pension products. Pillar II products are not obliged to advance a KID to their customers, albeit they must, of course, provide information akin to this package regularly.
17.4 Taxation
Spain’s Impuesto de la Renta de la Personas Físicas (IPRF), the personal income tax, is made of a dual system, whereby income from labour and income from savings are treated separately. Taxable income is split into two separate tax bases, each with its own applicable tax schedule: one, the “general” tax base for income from labour (wages, self-employment income, etc.) and pensions (assimilated to deferred labour income); the other, the “savings” tax base, for all income accrued from financial assets (interests, dividends, capital gains, annuities from IBIPs, etc.)
As regards the tax schedule for labour income, the tax bill may vary depending on the Spanish region where a retiree has their fiscal residence. Indeed, Spain’s personal income tax system is divided between the Central Government and its seventeen Autonomous Regions, along with the autonomous cities of Ceuta and Melilla. While the Central Government’s tax scheme is consistent across the country, except for the two foral (historical) regions of Navarre and the Basque Country, the regional tax schemes feature different income brackets and marginal tax rates, as shown in Table 17.10 and Table 17.11, with significant disparity in both tax rates and taxable income brackets.
| Tax base from... | ...to | Nominal marginal rates1 |
|---|---|---|
| EUR 0 | EUR 12 450 | 9.50% |
| EUR 12 450 | EUR 20 200 | 12.00% |
| EUR 20 200 | EUR 35 200 | 15.00% |
| EUR 35 200 | EUR 60 000 | 18.50% |
| EUR 60 000 | EUR 300 000 | 22.50% |
| EUR 300 000 | NA | 24.50% |
| 1 Only Central Government, only labor income; Interests and dividends are thoroughly taxed at 19%; Effective rates are sensibly lower. | ||
| Data: Agencia tributaria.; Spain has several government levels and PIT is roughly split in half between Central and Regional Governments | ||
| Region1 | Top income bracket (ordered) | Top marginal tax rate beyond top income bracket |
|---|---|---|
| Castilla y León | EUR 53 407 | 21.50% |
| Comunidad de Madrid | EUR 57 320 | 20.50% |
| Andalucía, Castilla-La Mancha, Galica, Región de Murcia, Ceuta y Melilla | EUR 60 000 | 22.50% |
| Cantabria | EUR 90 000 | 24.50% |
| La Rioja | EUR 120 000 | 27.00% |
| Extremadura | EUR 120 200 | 25.00% |
| Canarias | EUR 121 200 | 26.00% |
| Aragón | EUR 130 000 | 25.50% |
| Illes Balears | EUR 175 000 | 24.75% |
| Principado de Asturias, Cataluña | EUR 175 000 | 25.50% |
| Comunitat Valenciana | EUR 200 000 | 29.50% |
| 1 Two historical Autonomous Regions (Navarra and The Basque Country) are exempted from the common tax regime and therefore not mentionned here, while two Autonomous Towns are included (Ceuta and Melilla) | ||
| Data: Agencia tributaria. | ||
As regards savings and investments, Spain taxes income resulting from payments of interests, dividends or annuities, as well as financial gains resulting from the sale of financial securities or real estate. The progressive tax schedule for that income, known as tarifa del ahorro, is as follows:
- For gains until EUR 6000, a 19% tax rate applies;
- From EUR 6000.01 to EUR 50 000, 21%;
- From EUR 50 000.01 to EUR 200 000, 23%;
- From EUR 200 000.01 to EUR 300 000, 27%
- Gains above EUR 300 000 are taxed at a 30% rate.
Conventional pension plans
Contributions into conventional pension plans are deductible from an individual’s taxable income, up to a ceiling:
- EUR 10 000 per year in occupational pension plans (sistema de empleo), and;
- EUR 1500 per year in individual pension plans (sistema individual).
The differentiated ceilings result from a policy decision made by the Spanish government to favour savings into occupational pensions while drastically reducing the public subsidy to Pillar III pension plans. Enacted in two steps—in the State’s budget laws for 2021 and 2022—the tax deductibility of contributions into planes de empleo was raised by EUR 2000, while the ceiling for contributions into plans of the sistema individual was dropped from EUR 8000 to EUR EUR 2000 in 2021, then EUR 1500 a year later. While no increase in number of participants can be attributed for certain to the increased ceiling for Pillar II contributions (other measures to expand coverage are more likely to have played a role here), the reduced ceiling on the deductibility of Pillar III contributions had a more-than-substantial impact on the popularity of these pension savings vehicles.8. We note that, formally, personal contributions made by the individual participant are only deductible up to EUR 1500 in both pillars, but employees can deduct an additional EUR 8500 into occupational funds if these are fully or partially employer contributions.
Since 2022, the self-employed and business owners can join occupational pension plans corresponding to their activity or one of the planes de pensiones de empleo simplificados (simplified occupational pension plans) created by the reform of 2022. In that case they can deduct up to EUR 4250 of contributions to these plans per year from their taxable income, on top of up to EUR 1500 in contributions to Pillar III plans.
When the participant reaches retirement age and starts withdrawing funds from their pension plan, three scenarios are possible: - The accumulated capital is withdrawn as a lump-sum: 40% of the sum is exempt from tax, the rest (both principal and capital gains) is considered as labour income (despite the fact that Spain has a specific tax law provisions for income from savings and investments that could have been applied to capital gains) and taxed accordingly, depending on the income bracket of the participant; - The accumulated capital is converted into a life or term annuity: the annuity is then taxed as labour income (again without distinction between principal and capital gains); - The accumulate capital is partly withdrawn as a lump sum and partly converted into an annuity: each part is taxed applying the corresponding tax treatment.
Life insurance
Since 1999, Spanish tax law no longer enables individuals to deduct life insurance premia from taxable income. Interests and capital gains from life insurance policies are taxed according to the tarifa del ahorro (see above) at the time of payout. No tax applies to payouts of the capital itself.
In case of withdrawals in the form of a lump sum, the whole amount of interests and capital gains is subject to the savings personal income tax.
If the life insurance policy is converted to a life or term annuity, the whole annuity payment is, each year, considered as savings and investments income (thus subject to the tarifa del ahorro in its entirety). However, part of the annuity payment is exempted from tax, depending, for lifelong annuities, on the age of the holder at the time when the life insurance policy is converted into an annuity:
- Younger than 40 years old: 60% of annual payments;
- 40 to 49 years old: 65%;
- 50 to 59 years old: 72%;
- 60 to 65 years old: 76%;
- 66 to 69 years old: 80%;
- 70 years old and older: 92%.
There is, therefore, a strong incentive for life insurance policy holders to delay the choose conversion to a lifelong annuity as the payout option, and to delay that conversion as much as possible (interests and capital gains keep accumulating for longer, and most of the resulting annual income is then tax free). Note that these rules apply to all annuities except those acquired through inheritance or donations (i.e., they apply to, e.g., conversions of PIASs to annuity, see Section 17.4.4).
Insured retirement plans (PPA)
This vehicle has a similar tax treatment as standard Pension Plans, Contributions to these plans are tax exempted up to an annual limit of EUR 10 000 and benefits are taxed as labour income considering the recipients age at retirement. Capital gains are subject to a dual income tax scheme. The tax regime of this vehicle thus can be said to be of the Exempt Exempt Taxed (EET) kind.
Individual Regular Savings Plans (PIAS)
Contributions to PIASs are fully deductible from the holder’s taxable income: contributions are limited to EUR 8000 a year, every cent of which can be deducted.
Capital gains and payouts are taxed differently depending on the chosen payout option, the age of the holder and the duration of the contract since the first premium was paid in:
- If the older withdraws from their PIAS before 5 years have passed since the first premium was paid, taxes are due on all interests accrued and capital gains obtained until the date of the withdrawal.
- If more than 5 years have passed and the payout takes the form of a lump sum, that lump sum counts towards the taxable income from savings and investments for the year when the withdrawal takes place and the tarifa del ahorro (see above) is applied.
- If the payout takes the form of an annuity and more than 5 years have passed since the holder paid the first premium, capital gains are, once again exempt from tax and the annuity payment is taxed but (a) is subject to the savings tax rate and (b) is partially exempt from this tax, with the extent of the exemption depending on the age of the PIAS holder at the age of converting their accumulated capital into annuity, applying the same rules as applies to annuities from the conversion of life insurance contracts (see Section 17.4.2).
Long-term individual saving plans (SIALP)
The tax treatment applicable to SIALPs is very simple: - annual contributions up to EUR 5000 are deductible from taxable income; - if the accumulated capital is left on the SIALP for at least five years, the full amount of capital and interests is exempt from tax; - if the capital is withdrawn before five years, the whole amount is subject to the tax on income from savings and investments (the tarifa del ahorro applies)
17.5 Performance of Spanish conventional pension plans
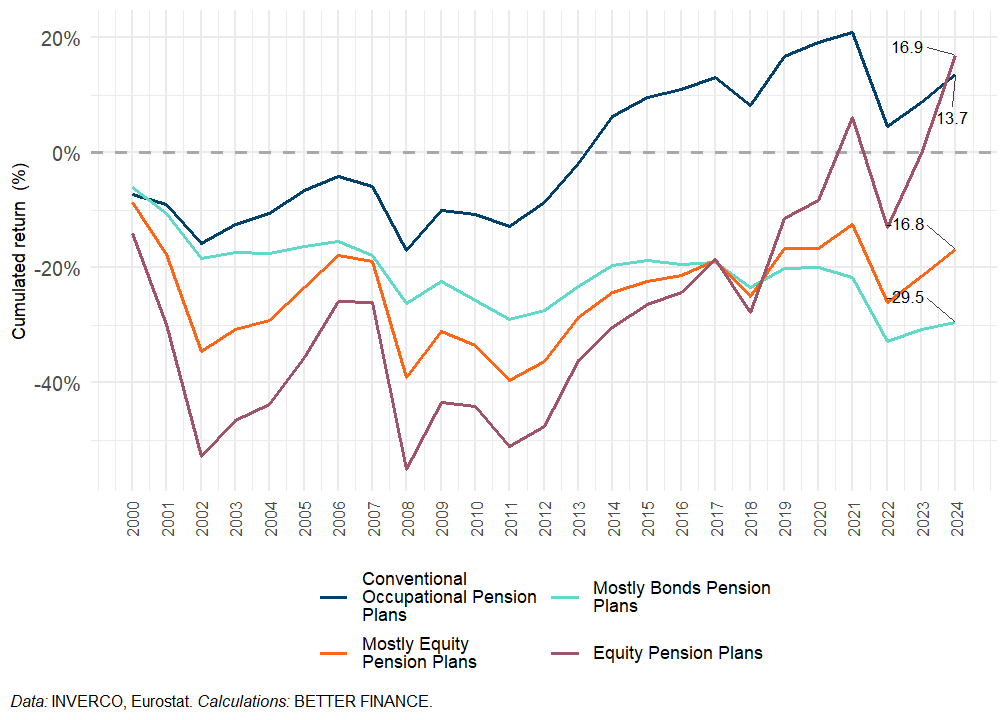
In this last section of the chapter, we look at the performance of the four largest categories of conventional pension plans, namely the occupational plans (Pillar II) and the personal plans (Pillar III) of the “mostly bonds” (renta fija mixta), “mostly equity” (renta variable mixta) and “equity” (renta variable) profiles. Beyond the costs of managing these pensions, which we analysed earlier (see Section 17.3), the long-term real net return of these plans is mostly driven by the performance of capital markets and inflation.
As regards equity markets, Spanish pension funds appear to diversify their investment worldwide: detailed data on all categories are not available, but INVERCO data for 2024 shows that only 4.2% of assets in “equity” individual plans are in the national market, 9.4% in the rest of Europe and 86.4% in the rest of the world. The performance of the equity investments of Spanish pension funds is, therefore, likely to reflect the performance of world stock markets. Fixed income investments appear to be more concentrated: INVERCO data on the geographical composition of fully long-term fixed-income individual plans show investments in Europe represent above 78% of the total AuM of these plans. The breakdown between Spain and the rest of Europe is not available, but we can safely assume that Spanish sovereign debt still constitutes a large part of the fixed-income investments in pension plans, meaning that this part of pension funds’ portfolios will have suffered heavily during the 2012-2015 period, when Spanish 10-year bond yields reached critical levels, amid the broader “sovereign debt crisis” which shook the foundations of the European Economic and Monetary Union (EMU).
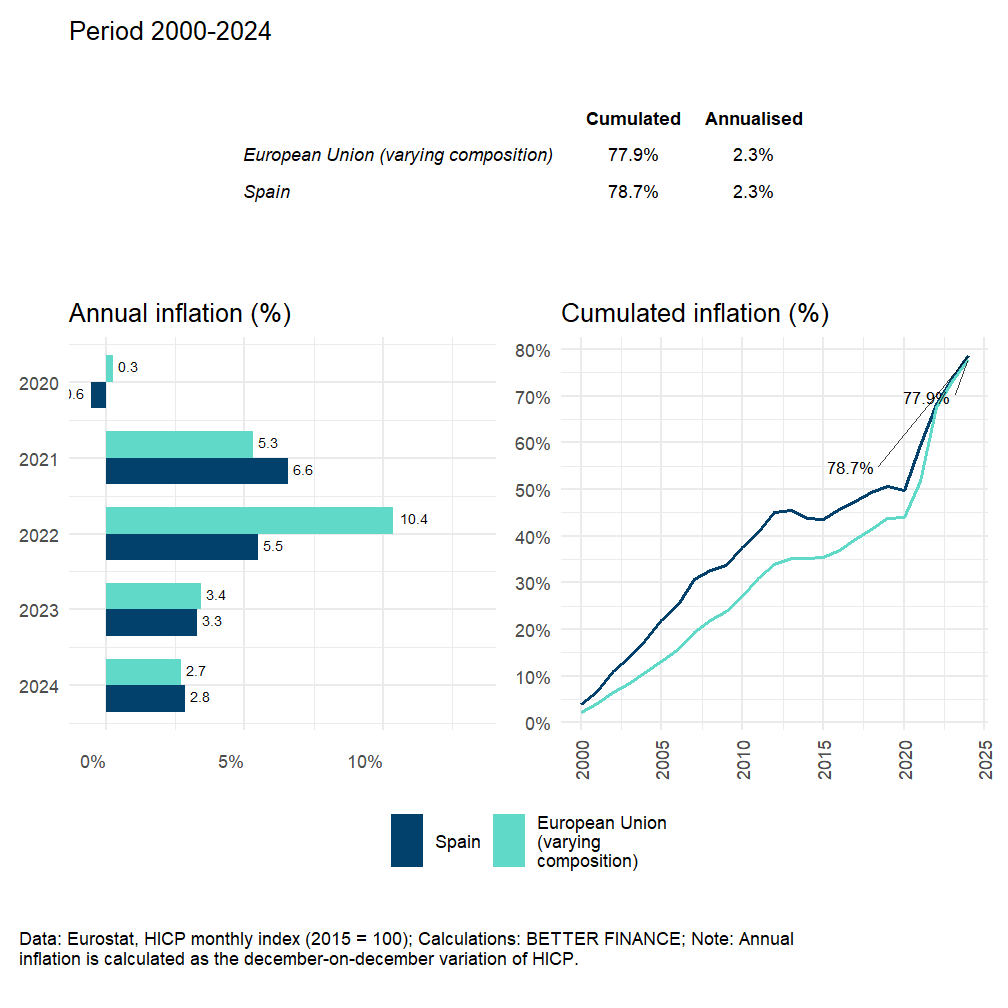
Turning to inflation, Spain displays a long-term evolution of prices that is generally in line with the EU’s average (see Figure 17.4). However, when looking at the annual data, we notice that Spanish inflation has been superior to EU average inflation for most of the period 2000–2012 (the gap between the blue and green lines in the right-hand side panel in Figure 17.4 widens), but generally inferior since (the gap narrows). In the latest inflation peak the EU suffered in 2021-2022, Spain suffered much less than the rest of Europe, with inflation peaking at 6.6% in 2021, versus a 10.4% peak in 2022 for the EU average.
Real net return of Spanish conventional pension plans
All the evidence produced in this section belongs to the conventional pension plans system (i.e., pension funds): due to data limitations, we cannot extend our analysis to insured retirement savings. All cost and performance data comes form the website of INVERCO, the Spanish body representing Mutual Investment Institutions and Pension Funds, while inflation data is calculated on the basis of Eurostat’s harmonised index of consumer prices (HICP) monthly index for Spain. The returns of Pillars II and III Pension Funds are displayed under in Figure 17.5, Figure 17.6, Figure 17.7 and Figure 17.8. The returns are classified as “gross”, “net” and “real”. “Gross” refers to returns before deducting management fees, depositary fees, and commissions (any retailing and other transaction costs are not explicitly shown). “Net” indicates the returns after these costs have been deducted. Both gross and net returns are nominal figures. In contrast, “real” returns are adjusted for inflation.
Since 2009, there has been a predominance of positive net nominal returns (exceptions being 2018 and 2022), with several years showing particularly strong returns on invested assets. 2024 was such a year, with nominal returns before costs ranging from +6% for the most conservative “mostly bonds” plans (under 30% of AuM invested in equity) to 21% for “equity” pension plans (over 75% of AuM invested in equity), which translates into strongly positive real net returns, despite inflation still higher than its historic average of the past two decades. This performance follows strong results recorded already in 2023, which completes Spanish pension funds’ recovery from the 2022 market crash. Those strong results were driven mainly by the dynamism of stock markets, which transpires from the particularly strong result of individual “equity” pension plans (see Figure 17.8).
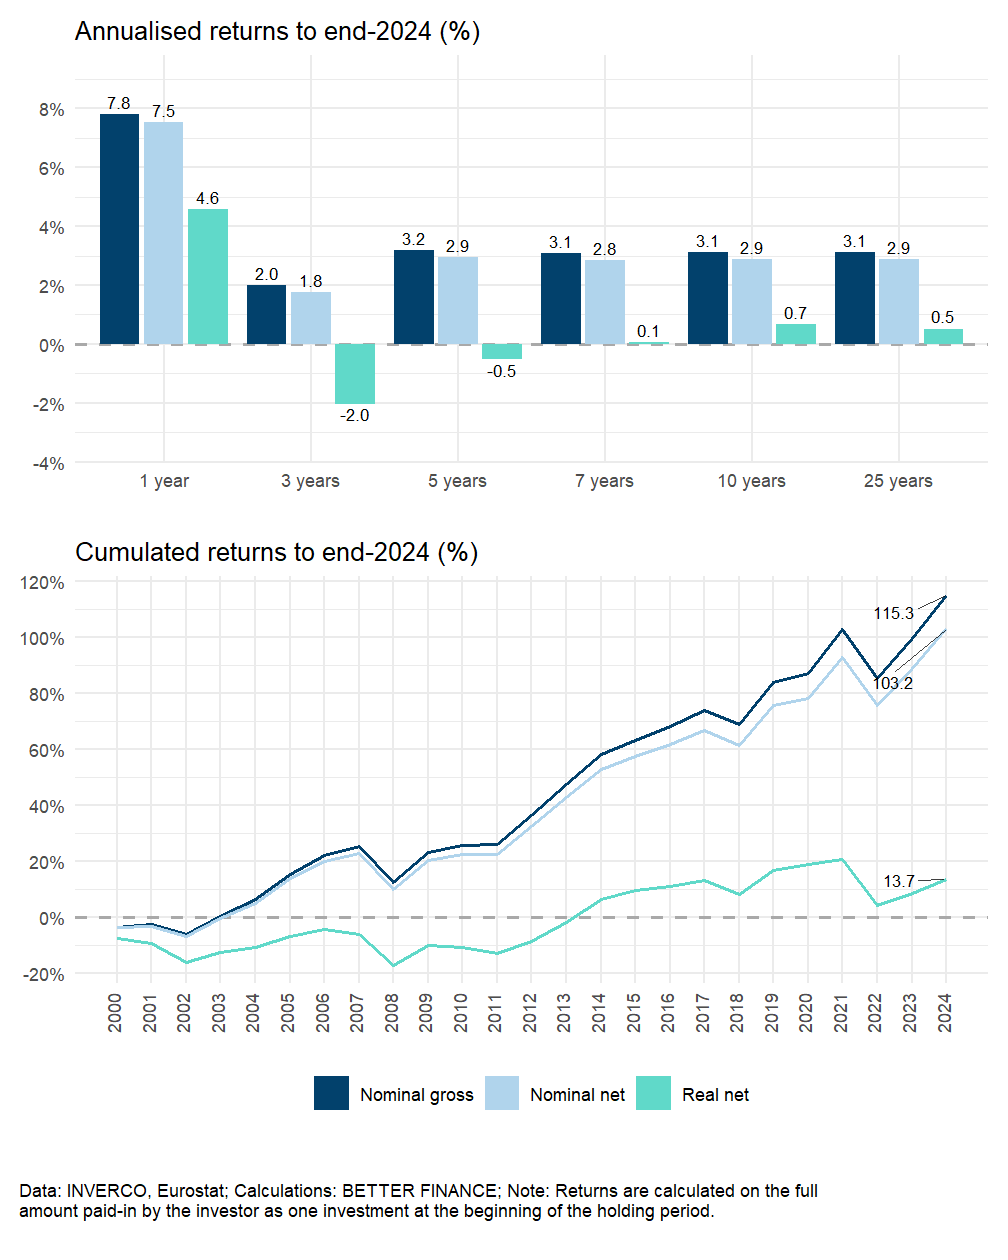
The performance of occupational pension funds, as displayed in Figure 17.5, show the dramatic impact of inflation over the long-term. While the limited costs of Pillar II funds (see Section 17.3) translate into a small gap between nominal gross and nominal net returns (12.1 percentage points (p.p.s) cumulated over 25 years, 0.2 p.p. on a annualised basis), the rather higher-than-average inflation in Spain over the first decade of the period prevented any significant increase in the purchasing power of these investments. The real net return thus only turned positive in 2014 and still has not recovered from the “perfect storm” of 2022. Overall, a Spanish worker participating in an average-performance occupational pension fund would see a +115.3% performance since 2000, but the quantity of goods and services that these pension savings would be able to buy would only be 13.7% higher at the end of 2024 than they were at the end of 1999.
Inflation had a similar impact on the purchasing power of pension savings in Pillar III funds, of course. However, for these funds, that depressing effect compounds the effect of the higher ongoing charges that pension fund managers generally levy on these plans. Over 25 years, the gap between nominal gross and nominal net returns reaches 53.6 p.p.s for “mostly bond” plans (Figure 17.6), 63.3 p.p.s for “mostly equity” plans (Figure 17.7) and 89.1 p.p.s for “equity” plans (Figure 17.8).9
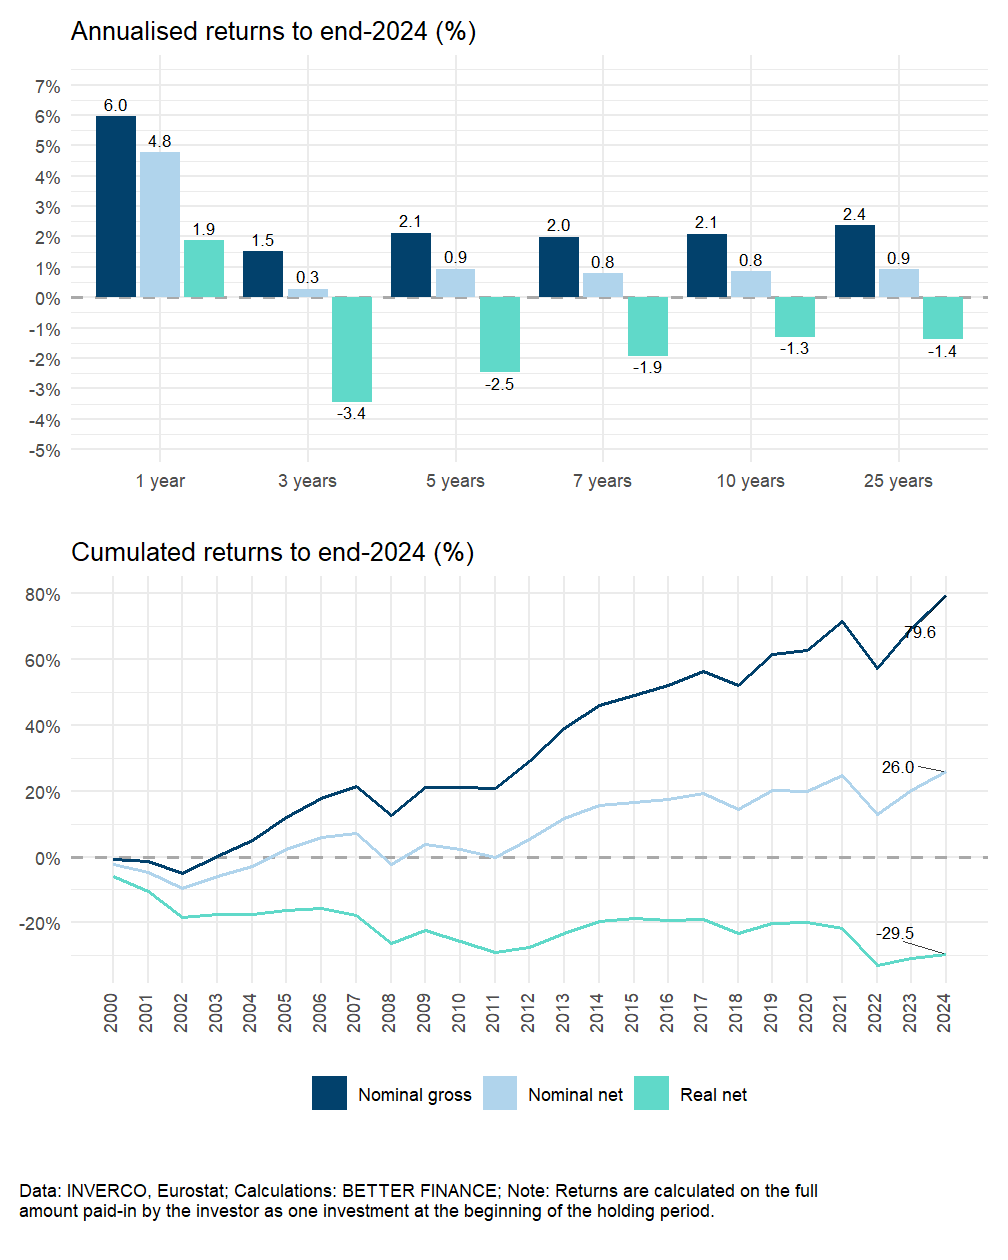
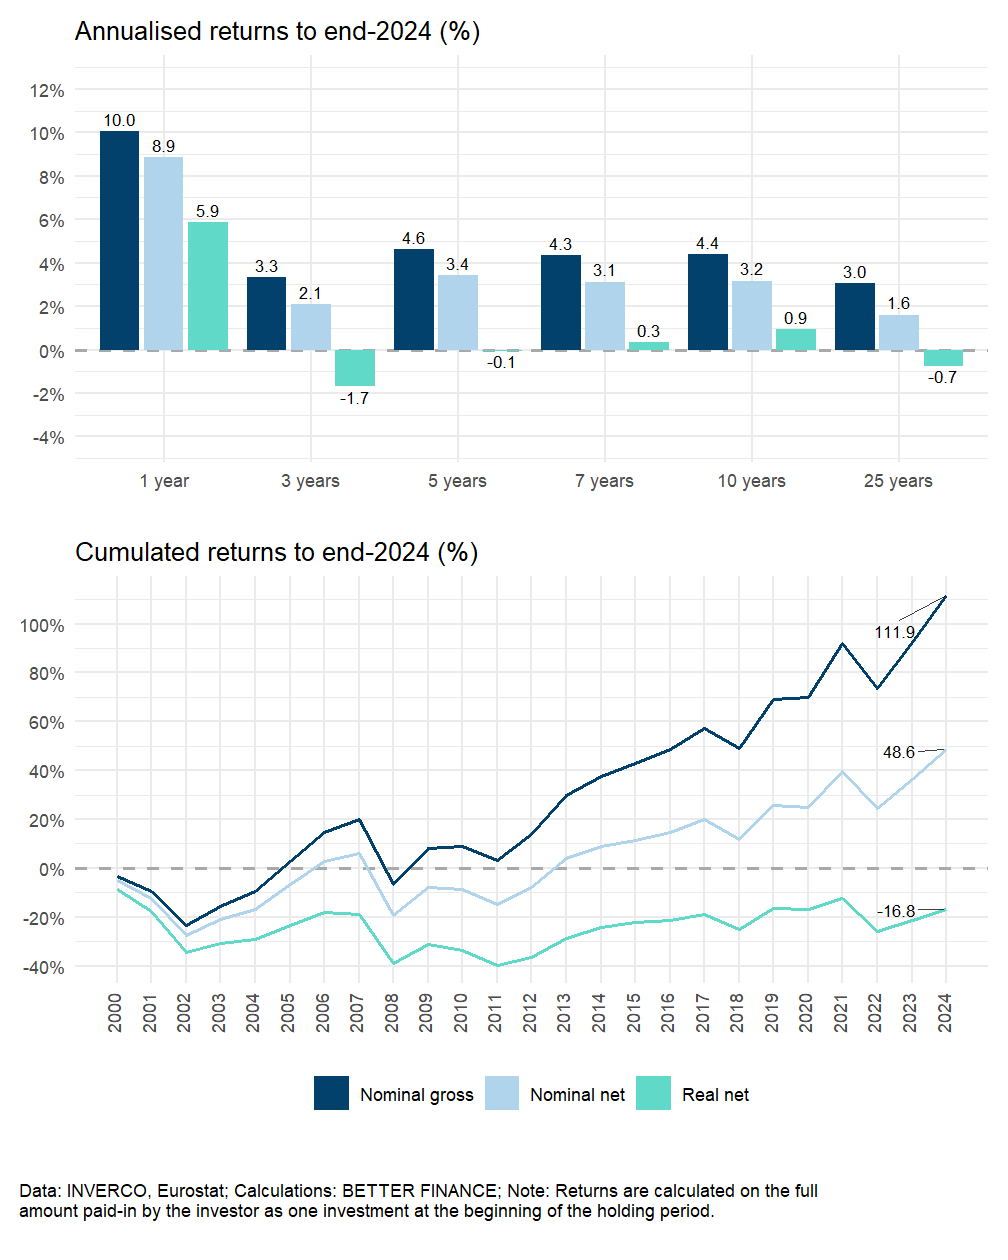
Adding to that the depressing effect of cumulated inflation, “mostly bonds” and “mostly equity” plans, both return a loss of purchasing power for their investors over 25 years, with annualised real net returns of -1.4% and -0.7%, respectively. Cumulated over the same period, this amounts to a loss of -29.5% for “mostly bonds” plans and -16.8% for “mostly equity” plans.
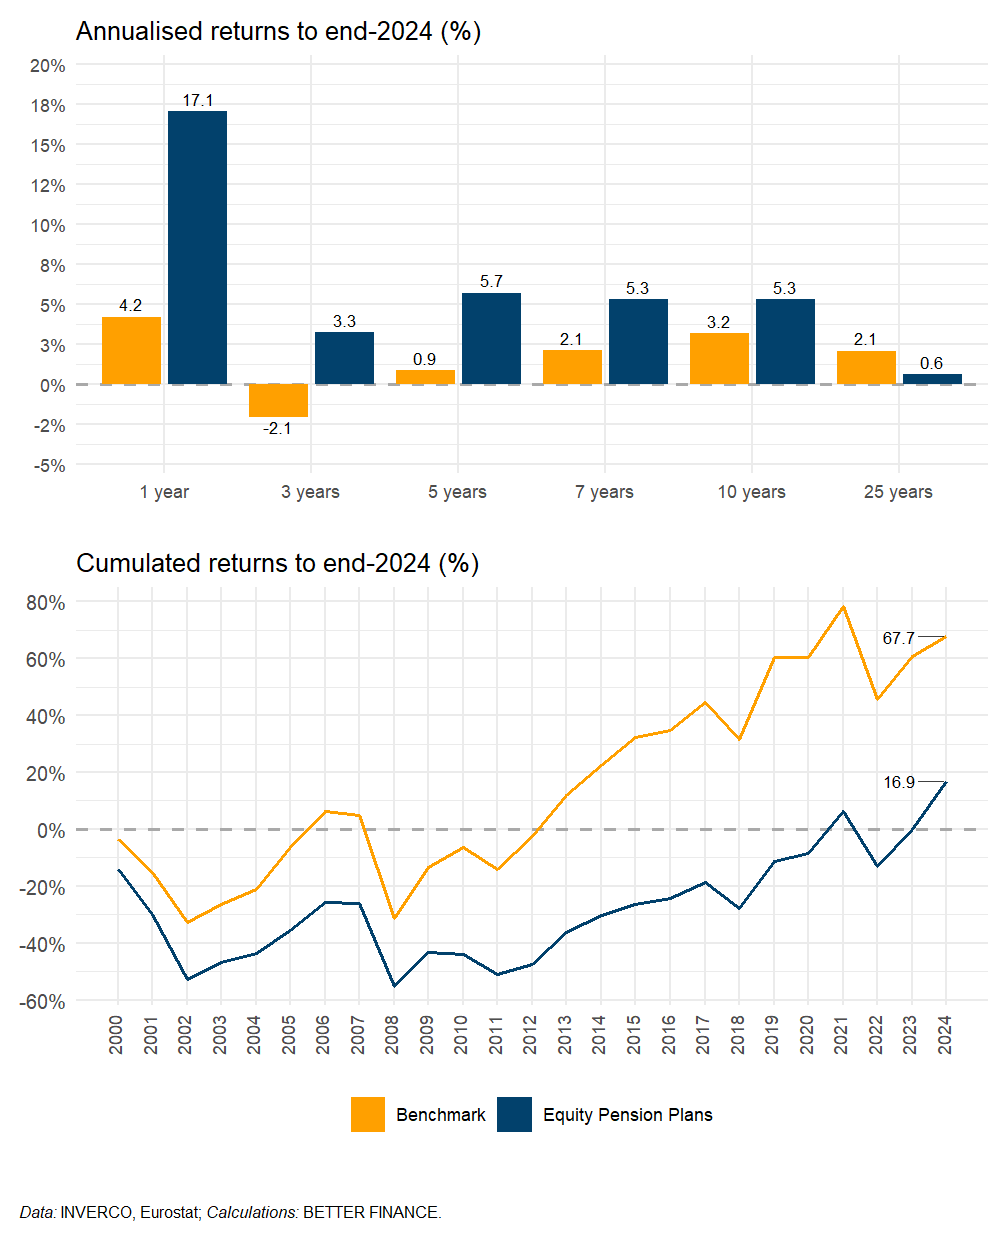
The only category of Pillar III plans that managed to yield a positive real net return after 25 years is that of “equity” pension plans, and that return only amounts to +0.6% on an annualised basis, which translate into a paltry +16.9% cumulated increase in purchasing power over the last quarter of a century. And then again, as can be seen in the lower panel of Figure 17.8, it took 22 years of reasonably high financial performance for an investment made in 2000 in those plans to just recover its original purchasing power (severely affected by the 2001-2002 and 2008 market crashes, which is reflected in the big gap between the 10-year and 25-year annualised return).
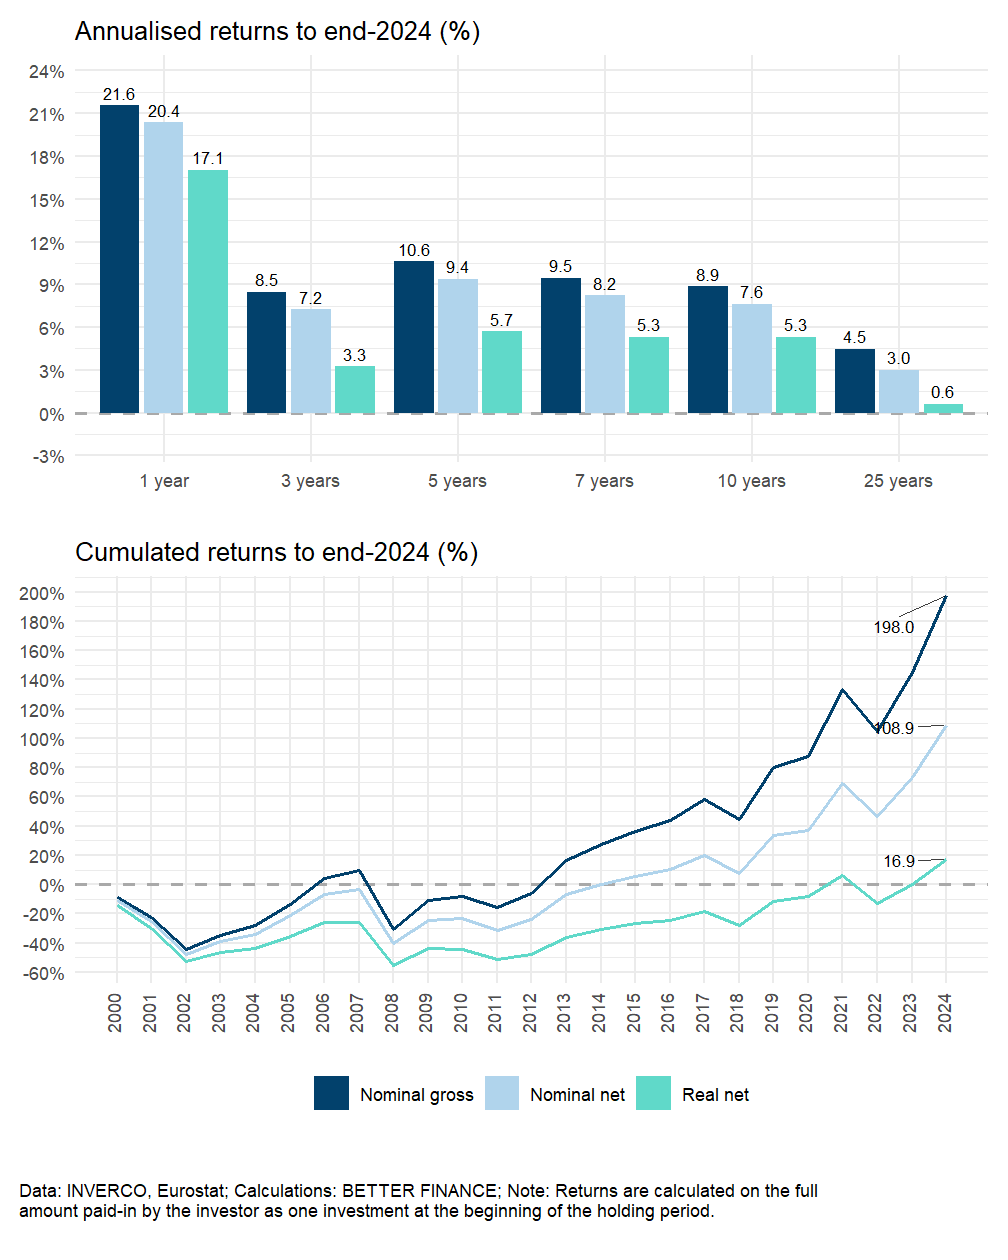
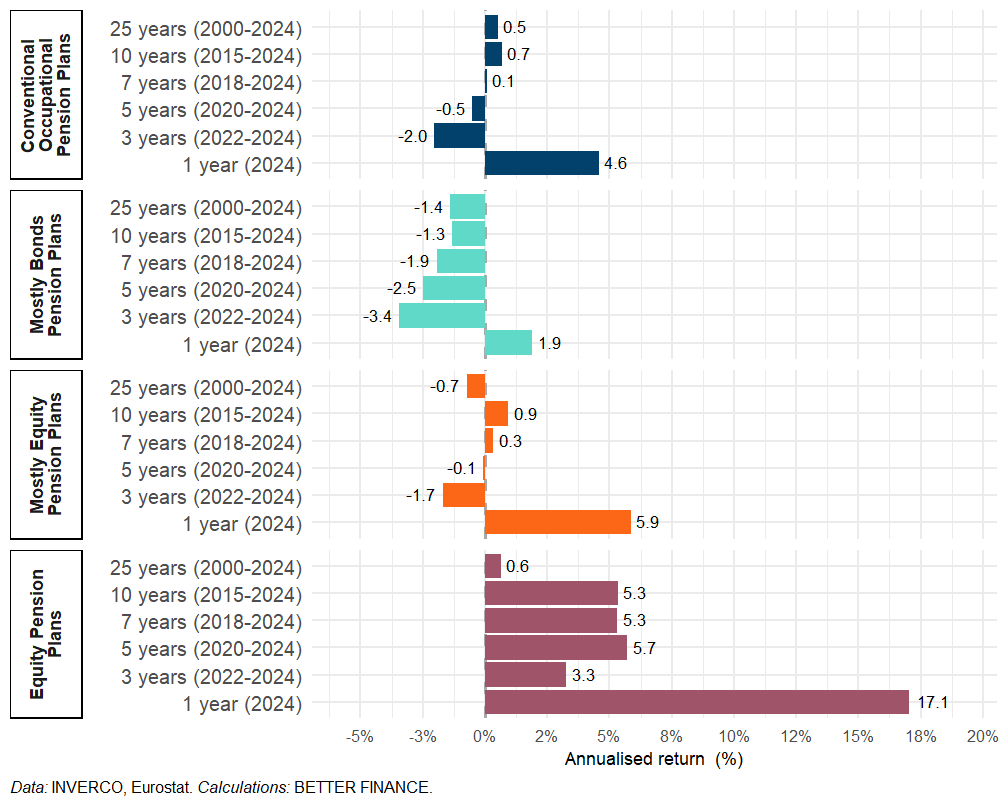
Figure 17.9 and Figure 17.10 display the real net performance of the various categories of conventional pension plans side by side. Being much cheaper to manage, occupational pension funds manage to yield a significant real net return comparable to that of individual “equity” plans over 25 years, even though their gross performance is not better. Among Pillar III funds, we observe that, for the same level of costs, the “best” performance is obtained by those funds that are mostly invested in equity, although they were, for a long period of time, the worst performing of the three categories of funds.
We shall see what the future holds. Should pension fund manage to sustain the trajectory of individual “equity” plans, which has been strongly positive over the past 10 years, these plans might turn to be a good option for Spanish pension savers with a long time horizon. Should they manage to reduce the management cost of these plans, the performance could even become strong enough to offset the desincentivising effect of the limited tax deductibility of contributions to those plans.
The analysis of the cost-and-performance data of occupational plans makes the government decision to extend the coverage of those plans and support contributions to them understandable: if not stellar, gross performance has been comparable to that of individual plans of the “mostly bonds” category, for a much more limited cost. The recent reforms of occupational funds, which increase coverage and triggered a concentration of funds into a limited number of “megafunds” may yet result in the sector reaching a scale that enables lower management costs per account and the ability to further diversify investment portfolios in search for higher yields. Supervision will be key to ensure that such is the result of that transition.
Do Spanish pension plans beat capital markets?
In this section, we compare the performance of the four categories of pension funds analysed in this chapter with the real returns of four hypothetical capital market portfolios over the period 2000–2023. Acknowledging the different asset allocations of the four types of funds, we have set the equity-bond balance of each benchmark portfolio at different levels; however the underlying indices are the two pan-European indices of the “default” benchmark (see introductory chapter). The composition of the benchmark portfolios is summarized in Table 17.12
| Equity index | Bonds index | Start year | Allocation | |
|---|---|---|---|---|
| Conventional Occupational Pension Plans | STOXX All Europe Total Market | Barclays Pan-European Aggregate Index | 2000 | 50%–50% |
| Mostly Bonds Pension Plans | STOXX All Europe Total Market | Barclays Pan-European Aggregate Index | 2000 | 30%–70% |
| Mostly Equity Pension Plans | STOXX All Europe Total Market | Barclays Pan-European Aggregate Index | 2000 | 50%–50% |
| Equity Pension Plans | STOXX All Europe Total Market | Barclays Pan-European Aggregate Index | 2000 | 75%–25% |
| Data: STOXX, Bloomberg; Note: Benchmark porfolios are rebalanced annually. | ||||
In truth, our benchmark portfolios for individual “mostly bonds” and “equity” plans respectively overestimate and underestimate the weight of equity in these plans. Equity represents 30% of the benchmark portfolio against which we compare the performance of “mostly bonds” plans, which are defined as being composed of at most 30% of equity; the actual average weight of equity in those plans is probably lower than 30%. Similarly, “equity” plans must be invested in equity markets to the tune of at least 75% of AuM, meaning that the average weight of equity in those plans is probably higher than the 75% equity of our benchmark portfolio. Nevertheless, we do not have sufficient data to ascertain what the respective weights of equity and fixed-income assets are in each of the categories.
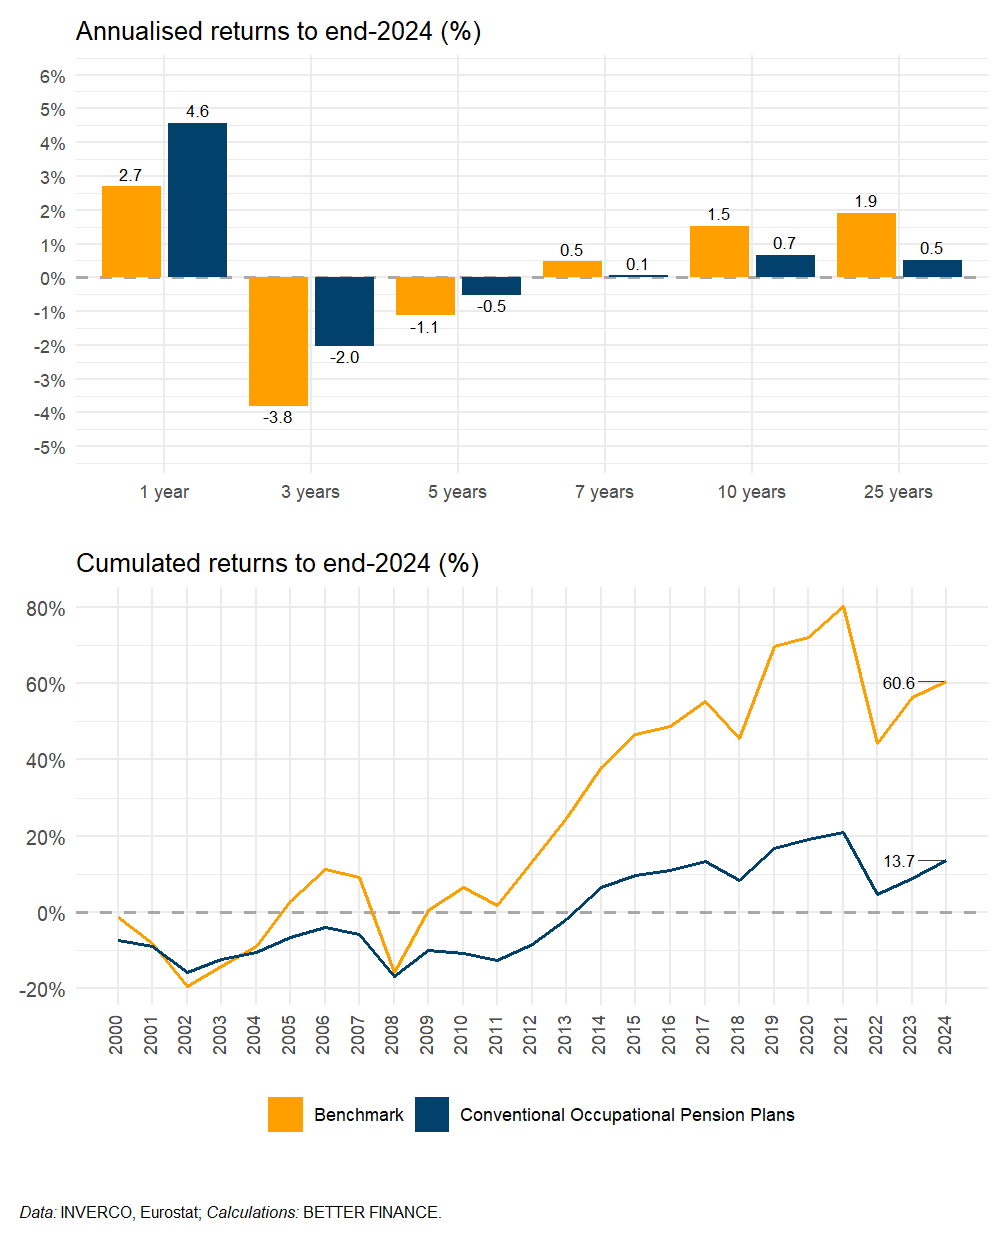
The substantially higher-than-benchmark return of occupational pension funds, on an annual average basis, over the past 1 to 5 years (see Figure 17.11) must not make us forget that, in the longer run, occupational pension plans have been widely underperforming compared to European capital markets (and remember that we are using here a rather conservative benchmark, based on European capital markets which have themselves been less dynamic than world markets). Over 25 years, the gap in performance, compared to our benchmark amounts to 1.4 p.p. per year on average, which translates into a 46.9 p.p.s cumulated.
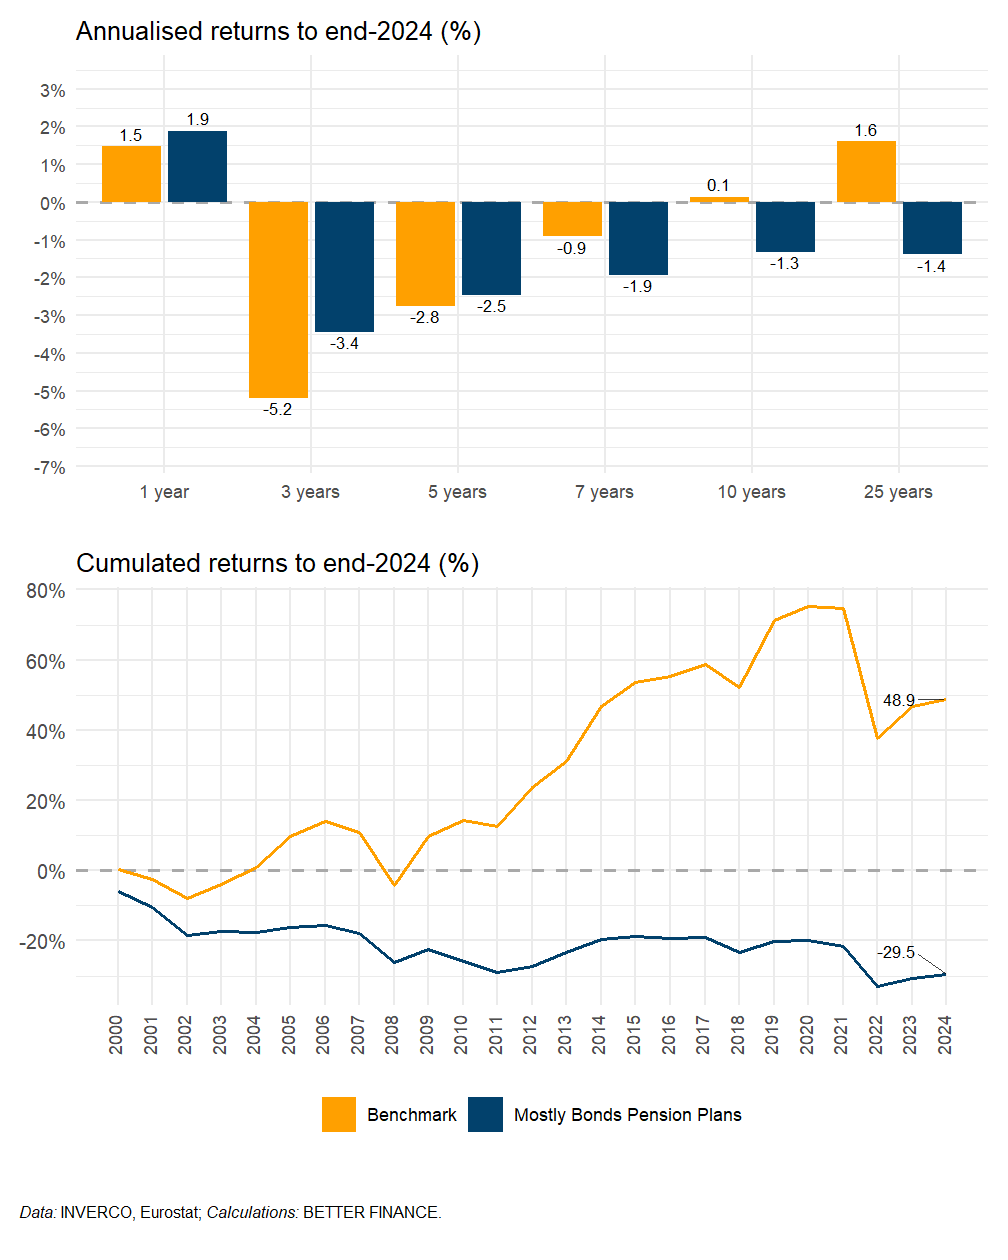
Over the past quarter of a century, individual pension plans have all underperformed their respective benchmark portfolios. “Mostly bonds” plans returned an annual average loss of purchasing power of -1.4%, to be compared to the +1.6% annualised real net return of a 30% equity–70% bonds benchmark portfolio (a 78.4 p.p.s gap in cumulated terms, see Figure 17.12). The comparison of “mostly bonds” individual plans to the 50% equity–50% bonds benchmark portfolio (Figure 17.13) is hardly more flattering, with annualised performance gap of 2.6 p.p.s, or 77.4 p.p.s in cumulated terms. The superior performance of the plans in recent years is an encouraging sign that things may be moving in the right direction for these plans, but pension savers who have been invested in these plans for the past decades have clearly been missing out.
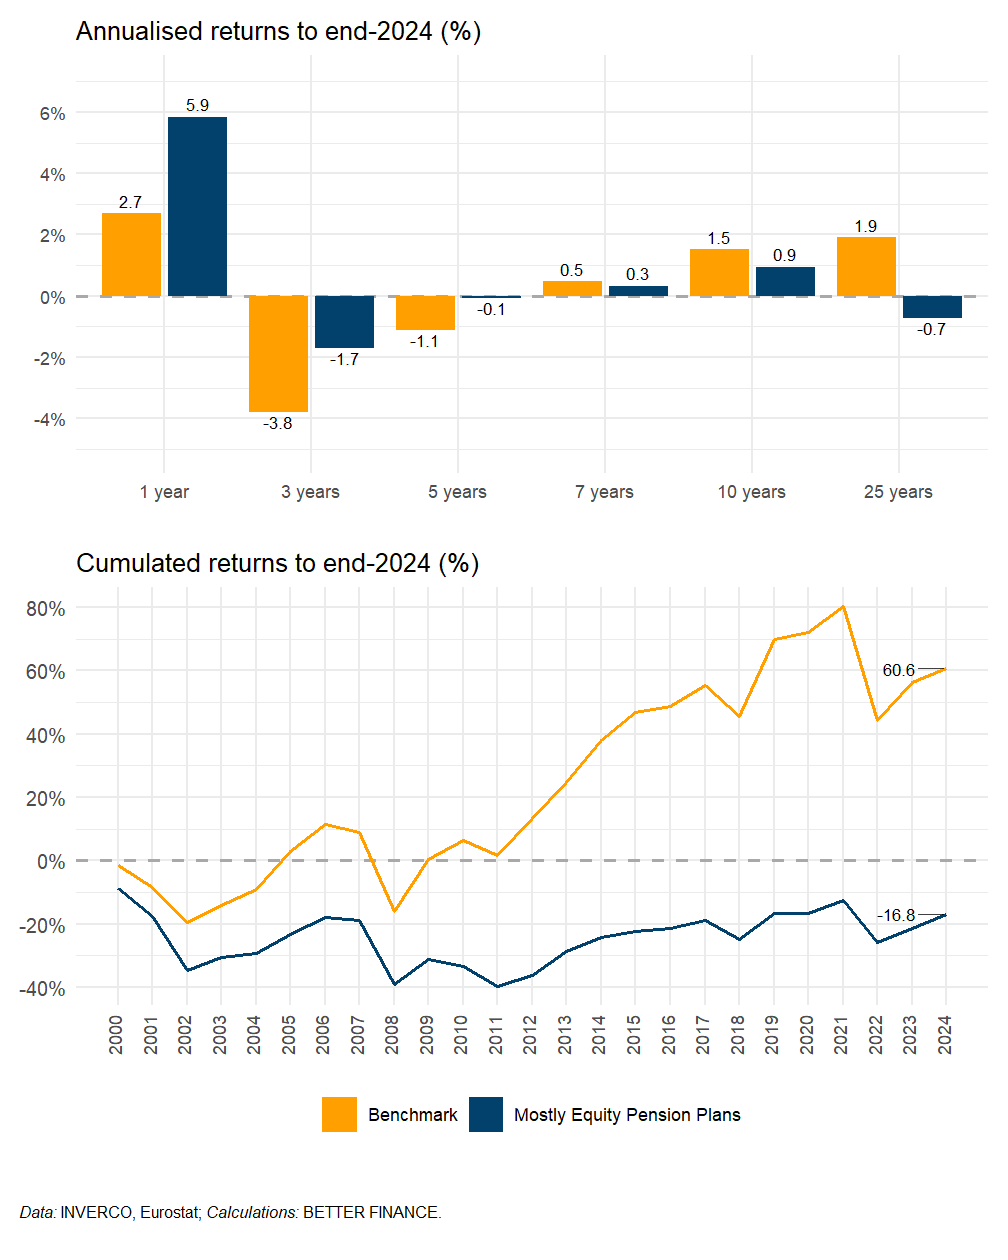
Comparing the performance of “equity” individual plans to that of a 75% equity–25% bond benchmark portfolio delivers a more nuanced picture. Looking at performance over the 25 years of data we have (December 1999 to December 2024, see the “25 years” bars in the upper pane of Figure 17.14 as well as the cumulated returns on the lower pane), we clearly see the underperformance of then plans: with an annualised real net return of +0.6%, the evolution of purchasing power of those savings is positive (a welcome exception in the Spanish landscape) but still far from the +2.1% of the benchmark portfolio. Cumulated over the whole period, the performance gap amounts to 50.8 p.p.s, less than that of the other individual plans but still substantial and more than occupational plans.
However, if we look at performance over holding periods or up to 10 years (upper pane of Figure 17.14), we see real net returns that are substantially higher than those of the benchmark portfolio, despite the bad performance of years like 2018 and 2022. Indeed, if we compute the cumulated return of the plans and of the benchmark since end-2015 (i.e., over the past 10 years), they amount to +68% and +37%, respectively: a 31 p.p.s overperformance of the average “equity” individual plans, nada mal.
17.6 Conclusions
Compared to other supplementary pensions sector analysed in this report, the Spanish one remains limited in size: the AuM in conventional pension plans offered by pension funds amount to 8.3% of GDP and the AuM in all categories of insurance-based pension products account for a further 13.3%, for a total amount of pension savings of 21.5% of GDP. That is not to say, of course, that Spaniards are improvident: many of them hold large buckets of financial and, crucially, real estate assets that they earmark for retirement. The issue is: what is the long-term performance of those assets?
For the conventional pension plans, we now have a clearer picture of what return they can offer. Of course, our analysis shows the average return of the those plans, and we must aknowledge, in all fairness, that many providers would offer better returns (just as many would offer worse). If anything this chapter has shown is the importance for Spanish pension savers to look beyond the various tax incentive they are granted to support their contributions to any of these plans: the level of fees levied annually for the management of one’s plan and the composition of the investment portfolio have, in the long run, a far larger impact on one’s wealth accumulation.
The second main teaching we can retain from the Spanish case is that supposedly “safe” pension savings plans—planes de renta fija, renta fija mixta or even renta variable mixta, which place a large share of savings into fixed-income assets to limit market volatility—actually constitute the safest road to a certain loss of purchasing power of one’s savings. The track record of “equity” pension plans may not be great for those pension savers that started investing in the early 2000s, but performance picked up since, and for more recent investors in those plans, those who started since the mid-2010s, the future might turn out to be brighter.
What next for Spain’s supplementary pensions? The government’s move to increase the coverage of occupational pensions and reform the sector sounds promising: time will tell whether it enables the sector to bring costs down and performance up for most—ideally all of—Spanish workers.
Cutting tax incentives on Pillar III plans was an unusual decision, considering the consensus in policy circles that tax incentives are necessary to make individuals save for retirement. Unusual does not necessarily entail entirely mistaken, however: after all, tax incentives constitute a fiscal expense, and why should taxpayers subsidize products that destroy the value of pension savings? Especially in a country whose population was forced into years of hardship after the mismanagement of its banks caused a financial and sovereign debt crisis. We can intuitively understand why Spaniards would say ¡basta ya! Yet, we should be careful not to throw the baby with the bathwater: not all individual pension plans are underperforming, as we have shown, and some—renta variable—do indeed enable a real wealth generation that could benefit younger generations of Spanish citizens while at the same time could increase the amount of funding available to develop the real economy.10 A drastic cut in tax incentives to these plans effectively signals the lack of support from policy-makers to them, which could put a hard stop to their further scaling up and to the potential economies of scale that it could bring. Many individuals would not look further than that signal, regardless of the actual performance.
Acronyms
- AuM
- assets under management
- CIALP
- Cuenta Individual de Ahorro a Largo Plazo
- DB
- Defined benefits
- DC
- Defined contributions
- DGSFP
- Dirección General de Seguros y Fondos de Pensiones
- EET
- Exempt Exempt Taxed
- EMU
- Economic and Monetary Union
- EU
- European Union
- FPEPP
- Fondo de Pensiones de Empleo de Promoción Pública
- FS
- Factor de Sostenabilidad
- GDP
- gross domestic product
- HICP
- harmonised index of consumer prices
- IBIP
- insurance-based investment product
- INSS
- Instituto Nacional del Seguro Social
- KID
- Key Information Document
- MEI
- Mecanismo de Equidad Intergeneracional
- MPS
- Mutualidad de Previsión Social
- OECD
- Organisation for Economic Co-operation and Development
- PAYG
- pay-as-you-go
- PIAS
- Plan Individual de Ahorro Sistemático
- PPA
- Plan de Previsión Asegurado
- PPE
- Plan de Pensiones de Empleo
- PPES
- Plan des Pensión de Empleo Simplificado
- PPP
- Plan de Pensión Personal
- PPSE
- Plan de Previsión Social Empresarial
- RiY
- reduction-in-yield
- SC
- Seguro Colectivo
- SD
- Seguro de Dependencia
- SIALP
- Seguro Individual de Ahorro a Largo Plazo
- SME
- Small and Medium-sized Entreprise
- TER
- total expense ratio
- p.p.
- percentage point
According to Organisation for Economic Co-operation and Development (2005); This sets Spain as the Organisation for Economic Co-operation and Development (OECD) country with the most generous public pension system, above Greece and Luxembourg, and far from the 17.4% replacement rate offered by Lithuanian public pensions, or even the 28.6% of Poland and the Netherlands, or the 29% of Danish public pensions.↩︎
Enacted by the Law 21/2021 of December 28th, 2021 on the “purchasing power of pensions and other measures reinforcing the financial and social sustainability of the public pension system” (Jefatura del Estado 2021).↩︎
The subsequent increases to the contribution rate enacted in 2023, as well as the somewhat better-than-expected economic performance of the Spanish economy may have significantly changed that number.↩︎
This being said, we should remark that pay-roll taxes to Social Security or other welfare programs are deferred wages and, were they to be entirely supported by employees, for a same level of retirement income, gross wages should be accordingly updated to accommodate this wedge.↩︎
“Associated pension plans”, a very minor category used by cooperatives’ members are classified as “other personal pensions” together with individual pensions within Pillar III vehicles by the regulator.↩︎
Insurance companies also promote PPA (“Insured Retirement Plans”) for the general public and PPSE (“Insured Employer Retirement Plans”). These insurance-based vehicles are essentially equivalent to their fund-based counterparts and share the same regulatory standards with them.↩︎
Five years seems more “medium term” than “long term” to the authors of this report, but to each their own.↩︎
Which can be seen either as evidence of the power of tax incentives as tools to overcome “procrastination” in pension savings and the importance of providing important tax incentives, or as evidence of the fact that, beyond the tax incentive, Spanish individuals hardly see the value of investing in such plans (which can, in turn, result from their poor performance or from the poor quality of the investment advice Spanish pension savers receive). We leave it to better informed analysts to find out which explanation is most likely.↩︎
Note that the only cost data available to us on the costs of Pillar III pension plans do not differentiate between profiles within the sistema individual, therefore we compute nominal net returns with the same cost figure for all three profiles. That most likely underestimate the nominal return of “mostly bonds” plans and overestimate that of “equity plans”, as the cost of managing equity investments is generally higher.↩︎
We should always be sceptical of claims that more pension savings will automatically translate into a more dynamic and jobs-rich economy for Europe: many conditions must be met for that to happen, and getting people to save for their pensions might be one of the easiest on the list to meet.↩︎