Product categories
|
Reporting periods
|
||
|---|---|---|---|
| Name | Pillar | Earliest data | Latest data |
| Pension funds | Occupational (II) | 2000 | 2024 |
Samenvatting
Het Nederlandse pensioenstelsel staat de laatste tijd volop in de belangstelling, nu er in EU-beleids kringen wordt gediscussieerd over manieren om de aanvullende pensioenen op het continent te versterken. Door de sterke afhankelijkheid van bedrijfspensioenfondsen in plaats van overheidspensioenen voor het waarborgen van een toereikend pensioeninkomen, vormt het Nederlandse stelsel inderdaad een buitenbeentje in Europa, dat velen waarschijnlijk graag zouden willen navolgen. Hoe de Nederlandse pensioenfondsen de ingrijpende hervorming van hun model aanpakken, is daarom van cruciaal belang voor heel Europa. De hervorming, die in juli 2023 van kracht werd, heeft tot doel het overwegend DB-model van de Nederlandse pensioenfondsen om te vormen tot een CDC-model dat de kernfilosofie van DC-pensioenregelingen combineert met sterke solidariteitselementen. Hoe dit de prestatiegeschiedenis en de tot nu toe dalende gemiddelde kosten van de bedrijfspensioenuitvoerders in het land beïnvloedt, valt nog te bezien: de overgangsperiode naar het nieuwe systeem loopt af in 2027. Ondertussen zien we in 2024 een vrij positieve prestatie, met een activagewogen gemiddeld reëel nettorendement van +3,6%, wat de goede resultaten van 2023 versterkt en helpt om de langetermijnrendementen te laten herstellen van de schok van 2022. Over de 25 jaar van observatie blijven de prestaties van Nederlandse pensioenfondsen enigszins gematigd (+1,6%), deels als gevolg van het langdurig lage renteklimaat van de jaren 2010.
Summary
The Netherlands’ pension system has drawn a lot of attention lately, as EU policy circles debate ways to beef up the continent’s supplementary pensions. With its heavy reliance on occupational pension funds rather than public pensions for the provision of adequate retirement income, the Dutch system is indeed somewhat of an outlier in Europe, which many probably dream to emulate. How Dutch pension fund manage the far-reaching reform of their model is therefore of crucial interest for all of Europe. Enacted in July 2023, the reform aim to transform the predominantly DB model of Dutch pension funds into a CDC model that combines the core philosophy of DC pensions schemes with strong solidarity elements. How that affects the performance track record and hitherto declining average costs of the country’s occupational pension providers remains to be seen: the transition period to the new system ends in 2027. In the meantime, we observe a rather positive performance in 2024, with an asset-weighted average real net return of +3.6%, which compounds the good results of 2023 and helps longer-term returns recover from the shock of 2022. Over the 25 years of observation, the performance of Dutch pension funds remain somewhat tamed (+1.6%), due in part to the low-for-long interest rate environment of the 2010s.
13.1 Introduction: The Dutch pension system
The Netherlands supplementary pensions sector features amongst the largest in the worlds, relative to the size of the country’s economy. Amongst the countries we study in this report, the Netherlands particularly stands out by the size of its occupational pensions sector, with EUR 1.6 trillion in assets under management (AuM). In this chapter, we focus our analysis on these occupational pension funds, which are currently in the midst of a major reform: the Wet Toekomst Pensioenen (WTP)—“law on the future of pensions”—which entered into force on July 1st, 2023, will transition this vast and predominantly Defined benefits (DB) occupational pensions sector to a new collective defined contribution (CDC) model that will combine a Defined contributions (DC) philosophy with solidarity features to limit the risk shifted onto the shoulders of individual pension fund participants.
In addition to the occupational pension funds, the Netherlands has a sizeable life insurance industry, which offers personal pension products (PPPs), even though that third pillar of the Dutch pension system is much more limited. Unfortunately, due to lack of publicly available data, we are unable to conduct a full analysis of the returns of those PPPs, or even a broad-brush analysis of the returns of the life insurance industry. Therefore, as shown in Table 13.1, in this chapter, we only analyse the performance track record of pension funds, from 2000 to 2024.
The strong performance of capital markets in 2024 reflected in a good nominal performance for Dutch pension funds—+8.1%—keeping them on the recovery path after the 2022 slump of global equity and bond markets. However, inflation, which had receded in 2023, shot up again in 2024, eating away close to half of the nominal performance of pension funds. As a result, the average real net return of Dutch pension funds in 2024 stood at +3.6%. The depressing effect of the 2022 negative returns and inflation peak is felt on annualised returns across holding periods from 3 years to 7 years; only the computed returns over 10 and 25 years are positive, as can be seen in Table 13.2.
Holding period
|
|||||||
|---|---|---|---|---|---|---|---|
| 1 year | 3 years | 5 years | 7 years | 10 years | Whole reporting period | to... | |
| Pension funds | 3.6% | -7.7% | -3.4% | -1.2% | 0.5% | 1.6% | end 2024 |
| Data: De Nederlandse Bank, Eurostat; Calculations: BETTER FINANCE | |||||||
In the remainder of this introduction, we will briefly present the Dutch pension system, including the Pillar I State pension. The next section will present in more detail the two main pension savings vehicles in use in the Netherlands: occupational pension funds and unit/index-linked life insurance policies. We will then look more closely at the data available on costs and charges and at the taxation regime applicable to those long-term and pension saving vehicles, before analysing their returns after charges and inflation from a long-term perspective.
Pension system in the Netherlands: An overview {sec-nl-intro-overview}
Like most of the country analysed in this report, the Netherlands have a classic three-pillar pension system whereby: - Pillar I is a contributory, state pension scheme organised as a social insurance system under the pay-as-you-go (PAYG) principle; - Pillar II is made of fully funded, mostly tax-exempt and—until now—comprising mostly DC schemes; - The much smaller Pillar III pillar is made of life insurance policies.
Pillar I: The AOW
The Algemene Ouderdowswet (AOW), the basic, universal pension paid by the Dutch State borrows its name from the 1956 law that established a lifelong pension for all elderly inhabitants of the Netherlands, regardless of their nationality and employment history (Algemene Ouderdomswet 1956).The amounts AOW pension benefits depend on the number of years an individual contributed to the Dutch social security system, but the system offers universal coverage (all residents are entitled). Each resident in the Netherlands between 16 and 66 years that is either employed, self-employed or on benefits contributes to the financing of the AOW—among other social security services—via a deduction from wages or benefits. A contribution from the State’s general budget covers the gap between these social contributions and pension commitments. Every inhabitant of the Netherlands is automatically enrolled in the AOW system and is entitled to 2% of the maximum monthly allowance for each year lived in the country between the ages of 16 and 66.1
The AOW is a PAYG scheme—a redistributive system whereby social security contributions from the current workforce are used to pay the current pensions—and is therefore sensitive to the ageing of the population. With an old-age dependency ratio of 32.5% in 2025 and a projected rate of 42.3% by 2050,2 the Netherlands is in a rather better position than most of the other countries in our study. This is in part due to the decision taken in the mid-1990s to raise the retirement age (AOW-leeftijd) continually on par with life-expectancy increases. That decision was tempered by a 1999 agreement between the government and social partners to limit the increase of the retirement age (Wet temporisering verhoging AOW-leeftijd 2019): After a transition period of five years, from 2020 to 2024, when the previously agreed retirement age for each year was reduced by 8 months, from 2025, the retirement age is set to increase by 8 months with every additional year of average life expectancy. Thus, based on current life expectancy expectations, Dutch residents born between October 1st, 1964 and September 30th, 1966 can enjoy AOW benefits when reaching 67 years and 3 months; those born between October 1st, 1999 and December 31st, 2000 will not receive them before they are 70 years old.3 The AOW pension is not payable before the AOW age (no early retirement) and cannot be deferred beyond that age, although it is possible to combine the pension and work (Organisation for Economic Co-operation and Development 2021).
Pillar II: Occupational pensions
The second pillar of the Dutch pension system is a system of collective pension schemes, organised on a per-company or per-sector basis. Occupational pensions in the Netherlands are fully funded, organised into pension funds which are legally independent from their sponsoring companies or groups of companies.
Each individual enrolled in a pension funds and their employer contribute directly or indirectly to it. The employer provides the major part of the contributions (usually between 50% and 70%), which are invested in order to fund retirement benefits.
Enrolment in an occupational scheme is, in many cases, compulsory: When trade unions and employers decide to set up an occupational pension scheme for a company or economic sector, the government has the possibility to make enrolment in that fund compulsory for all employees. This results into a near universal coverage of the Dutch active population by Pillar II pension schemes. Compulsory enrolment aims at increasing coverage of the working population, reduce costs per member through economies of scale, but also avoid a “race to the bottom” in the level of paid pension premiums. Enrolment is, then, automatic and mandatory, without possibility for an employee to opt-out from the pension scheme of their current employer.
An employee can participate in more than one occupational pension fund if they change employer during their career and the two employers do not contribute to the same pension scheme: The employee only actively contribute to the pension scheme of their current employer, while capital accumulated with the first employer’s scheme remains there until reaching retirement age or, subject to specific scheme rules, is transferred to the new employer’s scheme.
The Dutch and social partners in 2019 agreed a major reform of the Dutch pension system—the WTP—, the main measure of which is the transformation of occupational pensions from the currently dominating classic DB model to a CDC model, intended to ensure the long-term financial sustainability of Dutch pension funds. This CDC model shifts the financial risk previously borne by plan sponsors (employers, typically) to participants by making pay-outs variable and dependent upon the financial performance of the pension fund like in a classic DC plan. In this new Dutch system, pay-outs are thus adjusted annually to follow the performance of the fund.
What differentiates the Netherlands’ new CDC model from a pure DC model is that it retains important collective features intended to limit the potential impact of financial market volatility on participants. - First, longevity risk is pooled. Somewhat similar to an annuity, the funds must offer a lifetime income to retired participants, the amount of which is determined by the financial performance of the fund and average life expectancy. For a member who live a longer life, payments do not stop when benefits already paid-out exceed the contributions the individual paid-in. Conversely, if a member dies early the excess contributions (relative to the pay-outs they have received until their untimely demise) remain within the fund. These “mortality credits” then contribute to the funds’ ability to pay lifelong income even to members living until a biblical age. - Second, funds are to constitute a solidarity buffer, funded by contributions and returns on the funds’ investments. That buffer is to be used to smooth out the variations of benefits pay-outs (excess returns in good years augment the reserve, and the fund taps it to limit pay-out reduction in downturns).
The new CDC model implemented in the Netherlands comes in two flavours. By the end of the transition phase, on January 1st, 2028, for each pension fund, social partners will need to have chosen between the solidarity scheme and the flexible scheme. The solidarity scheme, which appears to be the most popular amongst pension funds, includes a collective investment strategy (i.e., the same investment strategy for the whole group) and a sizeable collective buffer to share risk across participants. The flexible scheme is closer to a traditional DC model, with smaller collective elements and more space for individual choice to be made by each participant.
Pillar III: Life insurance contracts
Pillar III is composed of individual pension products sold by insurance companies, including life insurance and pensioensparen—a special-purpose savings account intended for retirement savings. Pillar III products are offered to anyone in the Netherlands to save for retirement, either in complement or in lieu of retirement savings in Pillar II pension funds.4 Tax benefits applicable to Pillar III products make them attractive savings vehicles.
| Pillar I | Pillar II | Pillar III |
|---|---|---|
| State Pension | Occupational pension | Voluntary pension |
| AOW | Pension funds | Life insurance, pensioensparen, etc. |
| Mandatory | Mandatory | Voluntary |
| PAYG | Funded DB/DCa | Funded DC |
| Public | Private | Private |
| Social contributions and taxes | Employee/employer contributions (variable according to social partners' agreement) | Individual payments |
| Universal coverage | Quasi-universal | n.a. |
| [a] The WTP will transform occupational pensions from mostly a mostly DB system to a mostly DC one. | ||
13.2 Pension savings vehicles in the Netherlands
Occupational pension funds: The crown jewel
With EUR 1.6 trillion in AuM, the Dutch occupational pension fund sector is by far the largest in Europe. Its growth has been steady over the past quarter of a century, as can be appraised from Figure 13.1.
| Year | Nb. of funds |
AuM (EUR bln.)
|
Nb. of members (thousands)
|
||
|---|---|---|---|---|---|
| Total | Average | Total | Average | ||
| 2015 | 250 | 1 116.37 | 6.24 | 17 900.37 | 71.60 |
| 2016 | 245 | 1 195.50 | 6.46 | 18 242.67 | 77.63 |
| 2017 | 231 | 1 276.02 | 6.38 | 18 653.18 | 80.75 |
| 2018 | 224 | 1 328.55 | 6.36 | 19 175.28 | 87.16 |
| 2019 | 212 | 1 511.13 | 7.30 | 19 137.84 | 90.70 |
| 2020 | 201 | 1 571.01 | 7.86 | 19 192.00 | 95.48 |
| 2021 | 192 | 1 740.12 | 9.11 | 19 152.08 | 99.75 |
| 2022 | 185 | 1 518.85 | 8.25 | 19 063.07 | 103.04 |
| 2023 | 185 | 1 479.93 | 8.04 | 18 635.98 | 100.74 |
| 2024 | 178 | 1 627.02 | 9.19 | 19 332.34 | 108.61 |
| Data: De Nederlandse Bank. | |||||
The average occupational fund holds EUR 9.11 billion in AuM on behalf of a hundred thousand participants (see Table 13.4). That average size that has increased significantly in recent years, in part due to the consolidation trend that has characterised the sector: the number of pension funds decreased from 250 in 2015 to only 178 in 2014. But this average hides great disparity: as can be seen in Table 13.5 and Table 13.6, the largest of the Dutch pension funds—notably ABP and Zorg en Welzijn—are much larger than that.
| Fund | AuM | Nb. of members (thousands) |
|---|---|---|
| ABP | 523.9 | 3 139.7 |
| Zorg en Welzijn | 249.0 | 2 949.6 |
| Metaal en Techniek | 86.7 | 1 240.7 |
| Bouwnijverheid | 67.4 | 749.1 |
| Metalektro, bedrijfstakpensioenfonds | 57.3 | 629.5 |
| Data: De Nederlandse Bank. | ||
| Fund | Nb. of members (thousands) | AuM |
|---|---|---|
| ABP | 3 139.7 | 523.9 |
| Zorg en Welzijn | 2 949.6 | 249.0 |
| Personeelsdiensten | 1 477.2 | 3.5 |
| Detailhandel | 1 287.7 | 32.0 |
| Horecabedrijf | 1 284.5 | 13.8 |
| Data: De Nederlandse Bank. | ||
Four main types of occupational pension funds exist in the Netherlands. - First, the industry-wide pension funds administer and operate the pensions for an entire sector, such as food companies or civil service. ABP, the pension fund of civil servants, is not only the largest in the Netherlands, it is also the second largest pension fund in Europe. - Second, corporate pension funds administer and operate pension schemes for individual corporations, usually major ones. - Third, there exist several pension funds for independent professionals, such as medical specialists. - Fourth, and final, general Pension Funds have been created to achieve economies of scale and improve governance, being allowed to ring-fence and incorporate several (former) corporate pension funds under a single administrative umbrella.
In line with the European Union (EU)’s IORP II Directive (Directive (EU) 2016/2341 of the European Parliament and of the Council of 14 December 2016 on the Activities and Supervision of Institutions for Occupational Retirement Provision (IORPs) 2016), the assets of a Dutch occupational pension fund are strictly separated from the company (or any other organisation) that sponsors it. They are governed by social partners who delegate management to a professional manager.
As can be appreciated from Table 13.7, DB is by far the dominant structure of Dutch pension funds: in 2024, over 99% of Dutch pension assets were still invested “for the pension funds’ risk”.
| Year | AuM in DB plans | AuM in DC plans |
|---|---|---|
| 2015 | 1 144 999 | 4 618 |
| 2016 | 1 224 679 | 5 007 |
| 2017 | 1 289 499 | 5 736 |
| 2018 | 1 341 755 | 6 010 |
| 2019 | 1 506 816 | 6 500 |
| 2020 | 1 571 161 | 6 711 |
| 2021 | 1 738 194 | 7 757 |
| 2022 | 1 514 112 | 7 166 |
| 2023 | 1 471 794 | 8 564 |
| 2024 | 1 616 676 | 11 454 |
| Data: De Nederlandse Bank. | ||
Assets of DB vs. DC plans in Dutch pension funds, 2015–2024 (EUR mln.)
Under the still predominant DB system that the WTP is phasing out, pension funds are required to maintain reserves sufficient to cover all current and future pension benefits they will have to pay. This requirement is operationalised as a funding ratio that must remain above 104%. That funding ratio is calculated as the current value of assets divided by the current value of liabilities, where the current value of liabilities is calculated the actuarial interest rate determined by the De Nederlandse Bank (DNB), the country’s central bank, which supervises the sector. A fund can only index its benefits to inflation if its funding ratio exceeds 110%. Where a fund’s funding ratio falls below 104%, the fund manager is required to take measures to restore it. A funding ratio between 104% and 110% does not require action but forbids indexation of benefits.5
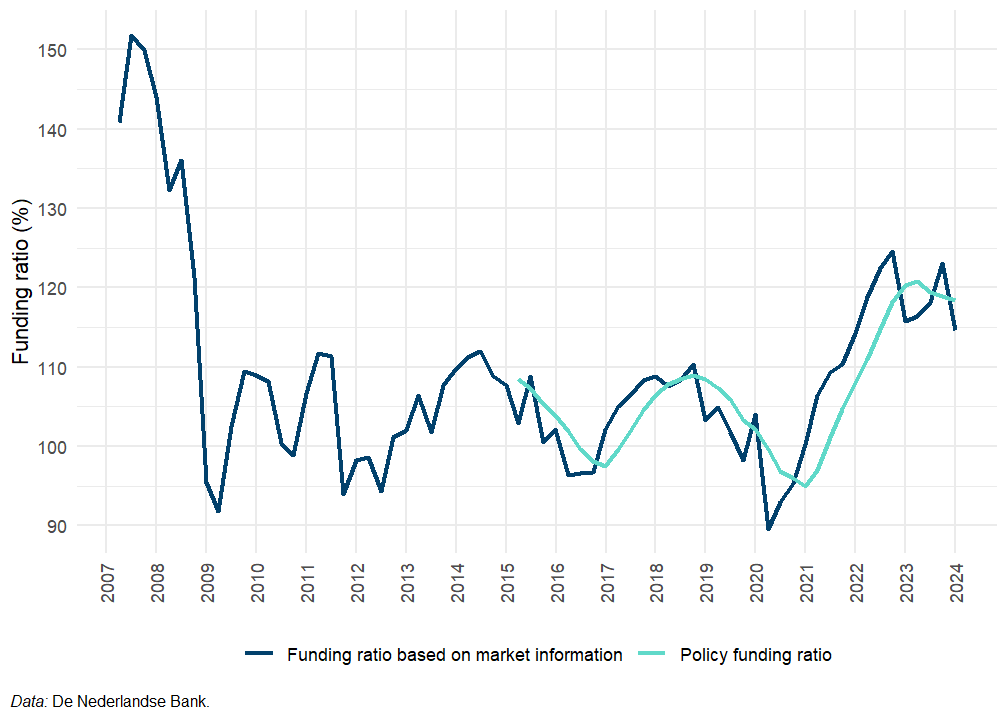
Figure 13.2 displays the average funding ratio of Dutch occupational pension funds published by the DNB. The “policy funding ratio” is calculated only since 2015, but the DNB also uses market data to compute the average funding ratio since 2007. It is obvious from these two lines that the mostly-DB pension funds had troubles navigating the long decade of extremely low interest rates between the global financial crisis of 2008-2009 and the interest rate hike of 2021-2022.
A cursory look at the sector’s asset allocation can provide a hint at one potential source of these difficulties: for most of the period, more than half of AuM in Dutch pension funds were invested in debt securities, the return on which was muted by persisting low interest rates. Equity investments, in the meantime, consistently remained below one-third of total investments. Reliance on debt securities seems to be be abating in recent years, with their share in total assets down from 58.1% of total assets in 2020 to 47.7% at the end of 2024 (see Figure 13.3). That turn away from debt securities does not seem to be to the benefit of equity investments, however, which appear to fall even further in recent years, closer to one-fourth of total assets.
By contrast, the relative share of alternative asset classes in the investment mix increased significantly over the past three years, reaching 12.2% of total assets in 2023 before falling back to a 8.3% that remains high compared to the historically small investments of Dutch investment funds in that category. Whether that greater exposure to alternative assets overall is a general trend in the sector or whether it is attributable to specific funds, we cannot say: the DNB only publishes data on asset allocation aggregated at the sector level, not for individual funds.6 Nevertheless, we venture that it would be worth investigating whether the consolidation trend that characterised the Dutch pension funds industry in the past decade might have enabled larger funds to dedicate human resources to the management of more complex, less transparent investments in search for high returns. Similarly, asset pooling and outsourcing arrangements whereby smaller funds mutualise resources may have contributed to this new orientation of investment strategies.
Pillar III: Life insurance
Besides its large occupational pension sector, the Netherlands boast a sizeable life insurance sector, which include PPPs as well as long-term investment products that, although not formally pension products, are used by individuals to constitute a capital that can be earmarked for retirement.7. The sector’s EUR 308 billion AuM at the end of 2024, is divided into three main categories:
- Life insurance “with profit participation” (EUR 63.4 billion)
- Unit- or index-linked life insurance (EUR 99.7 billion), and;
- Other life insurance (EUR 141.9 billion).
What part of these life insurance savings is effectively earmarked for retirement is unclear, but it is generally admitted that the bulk of retirement savings in the Netherlands rests in occupational pensions, not personal pensions. Residents in the Netherlands are largely free to contribute any amount they want to a PPP every year, and the banking and life insurance industry reminds them regularly that most of them probably have a “pension deficit” or “pension hole” (pensioengat or pensioentekort, usually defined as a projected retirement income below 70% of the last salary before retirement) as the main argument to constitute voluntarily a supplementary pension capital on top of what they may have saved within Pillar II schemes.
Nevertheless, the tax incentive to save in a PPP is limited: - In any given year, one can only deduct contributions to such products from their taxable income if they have a “pension deficit” in that year. If there is no pension deficit, no deductibility is allowed. - The amount that can be invested and deducted from taxable income is then limited to the “annual space” (jaarruimte), calculated on the basis of (a) one’s salary or other work-related income (for, e.g., the self-employed) and the amount by which one’s pension accruals have increased over the past year: there is annual space where accruals have been insufficient relative to one’s salary. Unused annual space in a given year is not lost: the unused annual space of the past 10 years constitutes an individual’s “reservation space” (reserveringsruimte), which can be used to increase the amount of contributions that can be deduced in a later year.8
As already mentioned, the share of those third-pillar products in the retirement mix of Dutch households is relatively low. The universal and near-universal coverage of Pillars I and II partly explains that Dutch savers see little need to add a third-pillar product to their portfolio.
13.3 Charges
Regarding transparency on costs, the Dutch pension savings landscape is quite contrasted: while the pension fund sector implements a rather clear and transparent reporting framework, there is no aggregate data of the costs of Pillar III products.
For a long time, data regarding costs and charges of Dutch pension saving vehicles were difficult to obtain and, where available, tend to only partially reflect the burden of these costs on investors’ returns. Following calls from Dutch national competent authorities (NCAs)—the DNB and the Autoriteit van Financiële Markten (AFM), the financial markets authority—to improve transparency, pension fund management companies agreed to work on a harmonised cost reporting framework. The self-regulation initiative became law in 2015, with the adoption of the “Pensions Communication Act” (Wet Pensioencommunicatie), which applies to data from 2015 onwards. The Federation of the Dutch Pension Funds consequently revised its “recommendations on administrative costs” to implement the new law (PensieonFederatie 2016).
Dutch pension funds today constitute one of the few cases where data on costs and performance is relatively plentiful (compared to other product categories in our study, see Figure 2.2), and, crucially, comparable across funds. The AFM nevertheless called on pension funds to do better: in a report published in 2021, it found that 54% of the funds’ annual reports either missed or reported incorrectly at least one cost metric (Autoriteit Financiële Markten 2021). The AFM also signalled the need for better explanations of costs, beyond aggregate figures. With the switch to a DC system, cost consideration will become increasing important:
Because of the transition costs that pension funds will have to deal with in the coming period, and the more prominent role that costs will have in participant communication in the new pension system, the AFM believes it is important to pay extra attention to accountability and transparency of costs now, on the eve of that transition.
As regards costs, the reporting framework mandates the disclosure of three main metrics: asset management costs, transaction costs (both in percentage of total AuM) and costs of pension administration per member (in EUR per member). As Table 13.8 shows, data before the Wet Pensioencommunicatie is essentially limited to costs of asset management.
| Year | Admin. and mgt. fees | Contract mgt. fees | Other ongoing fees |
|---|---|---|---|
| 2007 | 0.21% | NA | NA |
| 2008 | 0.25% | NA | NA |
| 2009 | 0.19% | NA | NA |
| 2010 | 0.15% | NA | NA |
| 2011 | 0.20% | NA | NA |
| 2012 | 0.22% | NA | NA |
| 2013 | 0.25% | NA | NA |
| 2014 | 0.19% | NA | NA |
| 2015 | 0.46% | EUR 113.63 | 0.09% |
| 2016 | 0.45% | EUR 111.72 | 0.08% |
| 2017 | 0.47% | EUR 112.11 | 0.10% |
| 2018 | 0.45% | EUR 101.20 | 0.09% |
| 2019 | 0.45% | EUR 104.10 | 0.09% |
| 2020 | 0.47% | EUR 107.85 | 0.11% |
| 2021 | 0.69% | EUR 107.60 | 0.09% |
| 2022 | 0.43% | EUR 112.02 | 0.11% |
| 2023 | 0.39% | EUR 123.26 | 0.10% |
| 2024 | 0.40% | EUR 136.83 | 0.09% |
| Data: De Nederlandse Bank Calculations: BETTER FINANCE. | |||
| Note: ‘Other ongoing fees’ represent the transaction costs, which are reported separately only since 2014; asset management costs and transaction costs: average of individual pension funds’ cost-to-AuM reported to DNB; contract management fees: average pension management costs per member weighted by number of members | |||
The sudden jump in these asset management costs from 2014 to 2015 should not be understood as an increase in the actual costs of Dutch pension funds: Instead what these figures reveal is that asset management cost figures until 2014 probably underestimate actual costs, and that the new reporting framework better captures the actual extent of these costs. Furthermore, over the past decade, pension funds have largely eliminated the payment of performance fees from their contracts with asset managers, leading to a reduction in costs. One should also note that the figures published by DNB for pension funds’ nominal returns are net of transaction costs, which are notoriously ambiguous and difficult to account for. In recent years, Dutch pension funds and regulators have made significant progress to more fully and transparently account for these costs, but we should assume that the actual transaction costs before 2015 were higher than the figures deducted from the gross returns reported to DNB, meaning that nominal returns may be overestimated. Naturally, since our computation of net returns relies on these figures, this implies that our calculations are likely to overestimate nominal and real net returns before from 2000 to 2015 (see Figure 13.7).
The asset-weighted average figures in Table 13.8 show the relative stability of the sector’s costs and charges. Except for a peak at 0.69% of AuM in 2021, the asset management charges have been oscillating in the area of 0.45% to 0.47% of AuM for the past decade, while the transaction costs remained below remain between 0.9% and 0.11% of AuM. The same stability characterised the contract management fees (in EUR per member) until 2021; since 2022 however, these fees are increasing significantly, which could be due to the WTP reform. Whether these higher administration costs are temporary (we are now in the middle of the transition phase) or whether they constitute the new normal remains to be seen: with the new CDC model involving the creation of individual accounts for pension fund participants, it is possible quite possible that administering pensions become more expensive.
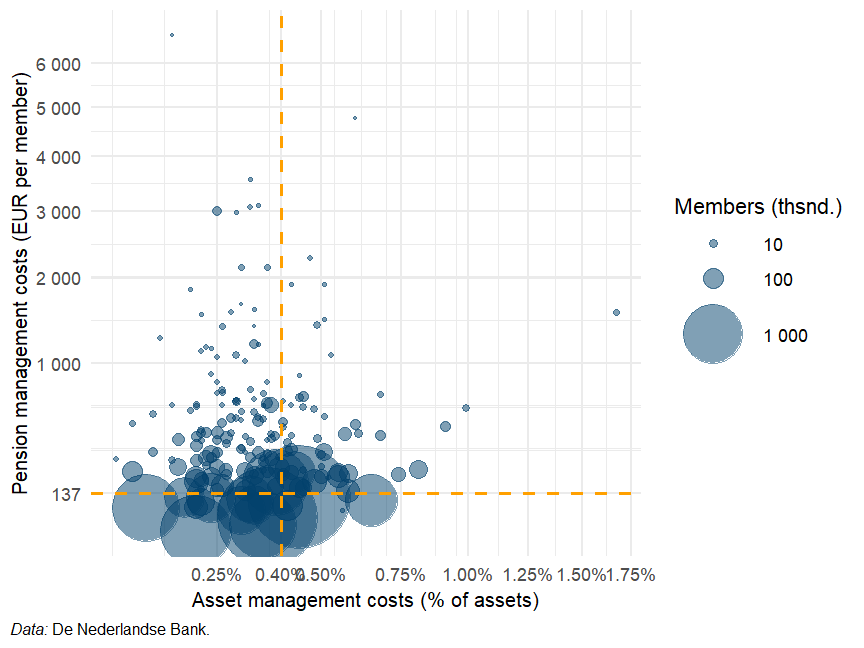
The fund-level data published by the DNB reveals important differences across funds. Figure 13.4 shows the distribution of Dutch pension funds across levels of asset management costs (horizontal axis, shown as a percentage of AuM per annuum) and levels of pension management costs (administrative charges for managing an participant’s pension, vertical axis, in EUR per member) in 2024, with the size of the dot representing the number of members. As regards asset management costs, there is no clear indication that the size of a fund matters: small and large funds can be found below and above the asset-weighted average of 0.4% in roughly equal measures. By constrast, as regards pension management costs, the largest funds concentrate in the lower part of the scale—driving the asset-weighted average administrative fee down to EUR 137 per member in 2024—but many smaller funds charge much higher fee levels, including above EUR 1000 per member per year. This seems to indicate that economies of scale play an important role.
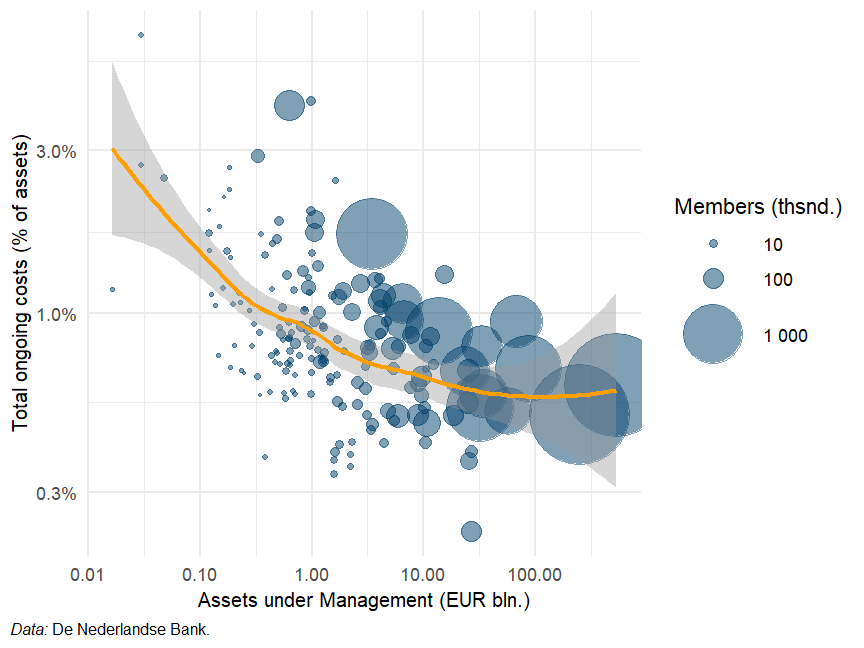
Generally, when including all costs, there seems to be a tendency for smaller funds to levy more annual charges off their members’ assets. The fit line in Figure 13.5 shows this relation: the level of costs drops rapidly until approximately EUR 500 million in AuM; the reduction then slows until EUR 100 billion, before increasing marginally again for the largest two funds.
We unfortunately could not obtain cost data related to life insurance contracts in the Netherlands. Data available about life insurance arises from prudential reporting mandated by Directive 2009/138/EC (“Solvency II”) and focuses on the balance sheet of life insurance companies rather than on cost and performance of the products they distribute.
13.4 Taxation
Pension funds are exempt from company taxes in the Netherlands. The money that Dutch employees pay into their pension funds during their working like is deducted from their gross income and therefore exempt from income tax. The returns on the investments made by pension funds on behalf of pension scheme participants are not taxed either.
Pension pay-outs—the amounts paid monthly to pension scheme participants from the moment they reach retirement age—are subject to personal income tax. The personal income tax rate applicable to the first income bracket is, however, much lower for pensioners than for the active population: in 2025, Dutch residents over 67 years only pay 17.85% on their income up to EUR {41 123}, while those 66 years old or younger pay 35.75% in taxes for income up to EUR {38 883}.9
As already mentioned, contributions to voluntary, Pillar III products are similarly tax exempt (within the limit of an individual’s jaarruimte, see Section 13.2.2) as are returns on those investments. Payouts are, like payouts of pension funds, taxed at the personal income tax rate.
The Dutch tax system for pension savings therefore follows the dominant Exempt Exempt Taxed (EET) model, as summarised in Table 13.9.
| Product categories |
Phase
|
Fiscal Regime | ||
|---|---|---|---|---|
| Contributions | Investment returns | Payouts | ||
| Pension funds | Exempted | Exempted | Taxed | EET |
| Life insurance | Exempted | Exempted | Taxed | EET |
| Source: BETTER FINANCE own elaboration, based on Belastingdienst. | ||||
13.5 Performance of Dutch pension funds
Real net returns of Dutch pension funds
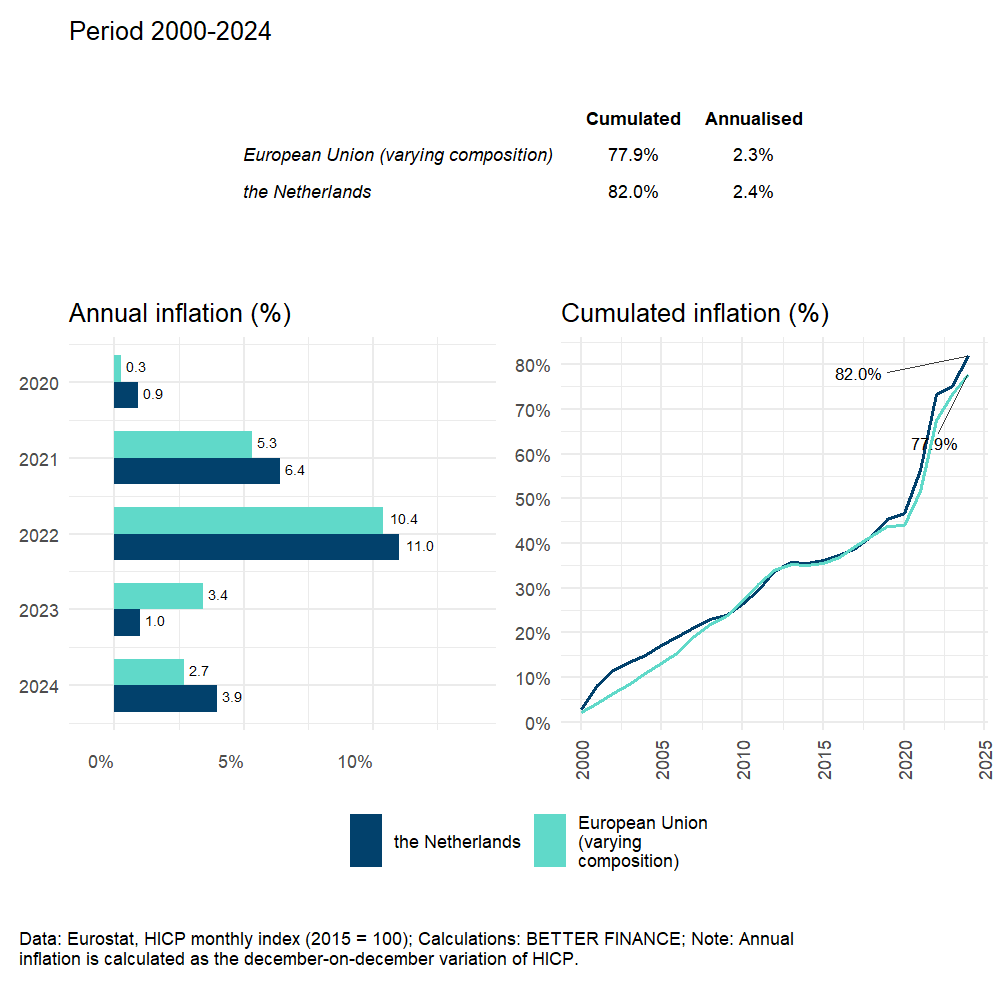
After presenting the Dutch pension system and its main pension saving vehicles, discussing the evolution of pension funds’ costs and summarising the tax regime applicable to pension savings, we now turn to the analysis of returns. 2024, like 2023 was a rather positive years for Dutch pension savings, driven by a strong performance of capital markets. Inflation, however, rose up again in 2024 to 3.9%, above the EU average (see Figure 13.6). Viewed in a long-term perspective, the Netherlands has a relatively moderate inflation—2.4% annualised over the period 2000–2024, just 0.1 percentage point (p.p.) above the EU average—but even that moderate annual inflation entails an 82% loss of purchasing power for Dutch pension savers of the past 25 years.
In the remainder of this section, we will report annualised and cumulated returns of Dutch pension funds. We base this analysis on the data made available by the DNB, which enables us to calculate aggregate returns for pension funds since 2000. For this country case, we follow the methodology presented in the introductory chapter of this report.
Two successive years of strong nominal gross performance—+8.7% in 2023, +8.1% in 2024—largely made up for the heavy losses that Dutch pension funds suffered in 2022 (-21.1%): the annualised gross return is still negative over the past 3 years (-2.5%) but positive for all periods longer than 4 years, as shown in Figure 13.7. Cumulated from 2000 to end-2024, nominal returns reached 189.3%, which is still below their peak of 212.1% reached at the end of 2021, but shows evidence of a solid recovery.
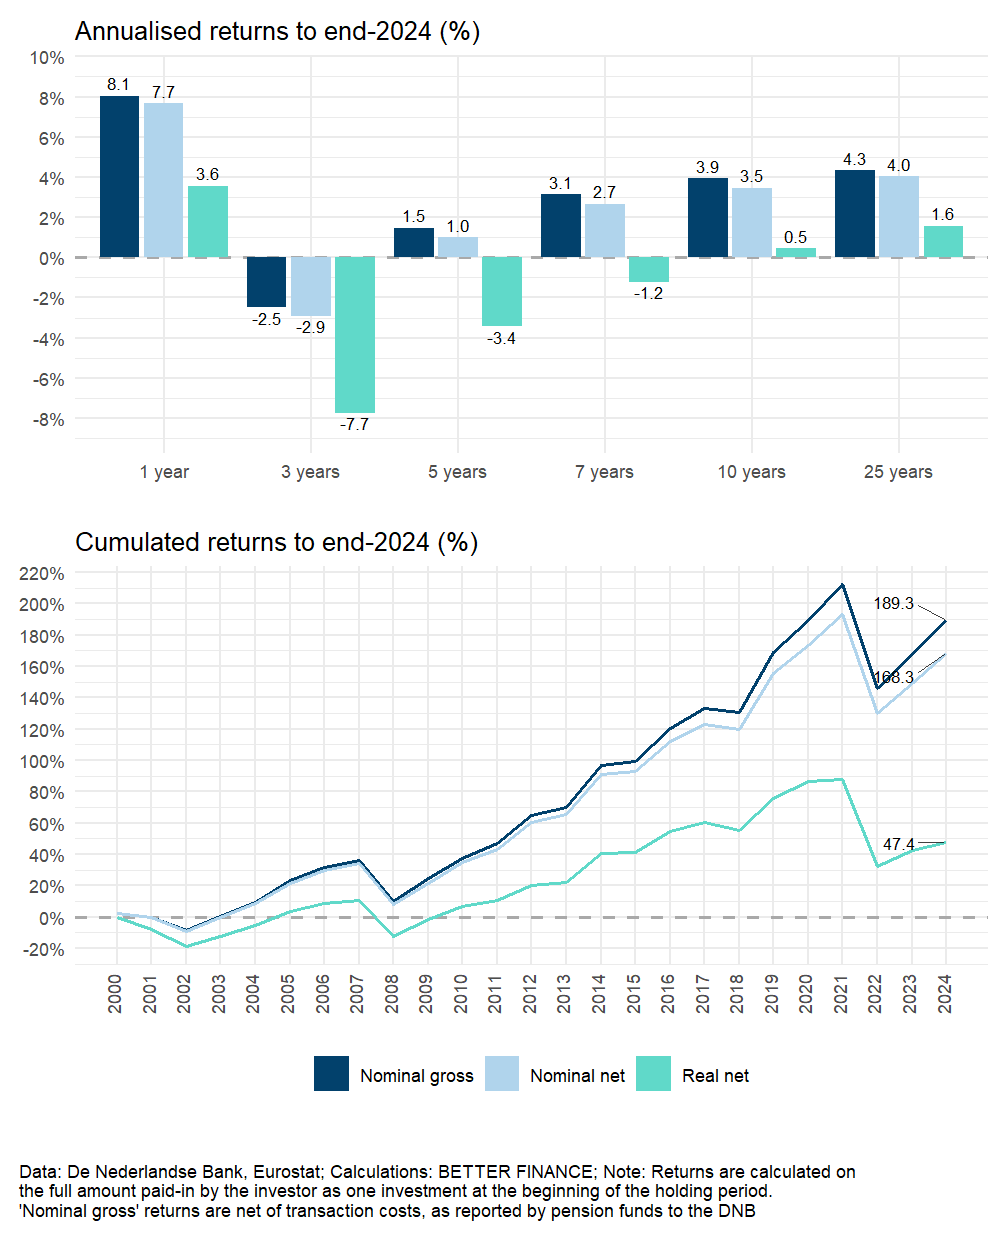
We can see by the proximity of the nominal gross and nominal net returns that the long-term impact of costs is moderate, reducing returns by only 21 p.p. after 25 years. We should note that this difference only represents asset management costs: transaction costs are already deducted from nominal “gross” returns and we do not deduct the pension administration costs per member.10
Real net returns, however, remain low: the 2021-2022 inflation peak affected the Netherlands like most other EU countries (+11% in 2022), which compounded the losses on invested assets. The +3.9% inflation rate in 2024 severely reduced the positive nominal returns on investments.
Overall, Dutch pension funds’ performance track record shows a steady course of capital accumulation, with setbacks in 2001-2002, 2008, 2018 and, as already mentioned, 2022. The relatively high allocation of the sector’s assets to fixed income investments made for limited volatility. However, once we adjust for inflation, that asset allocation leads to limited real generation of additional capital for the members of Dutch pension funds.
The WTP reform is still ongoing and it is, as a result, hard to say the effect the new CDC model will have on asset allocation, costs and, in fine, returns. Under the current DB model, those limited returns—consistent as they may be—have often resulting in funding ratios that were too low for pension funds to index pension benefits to prices. We must hope that the new model will enable Dutch pension funds to generate higher returns for participants.
Do Dutch pension funds beat capital markets?
As a last step in our analysis of Dutch pension funds’ returns, we compare their performance with that of a hypothetical portfolio invested in European capital markets. The portfolio used here is our “default” 50% equity–50% bond portfolio, annually rebalanced, presented in Section 1.2.4. The composition of the benchmark portfolio is summarised in Table 13.10.
| Equity index | Bonds index | Start year | Allocation | |
|---|---|---|---|---|
| Pension funds | STOXX All Europe Total Market | Barclays Pan-European Aggregate Index | 2000 | 50%–50% |
| Data: STOXX, Bloomberg; Note: Benchmark porfolios are rebalanced annually. | ||||
The nominal returns of this benchmark portfolio are adjusted—like the returns of the products—using the inflation rates calculated based on Eurostat’s HICP monthly index for the Netherlands. For each product category, we calculate the returns of the benchmark over the same period as the average returns of the product category.
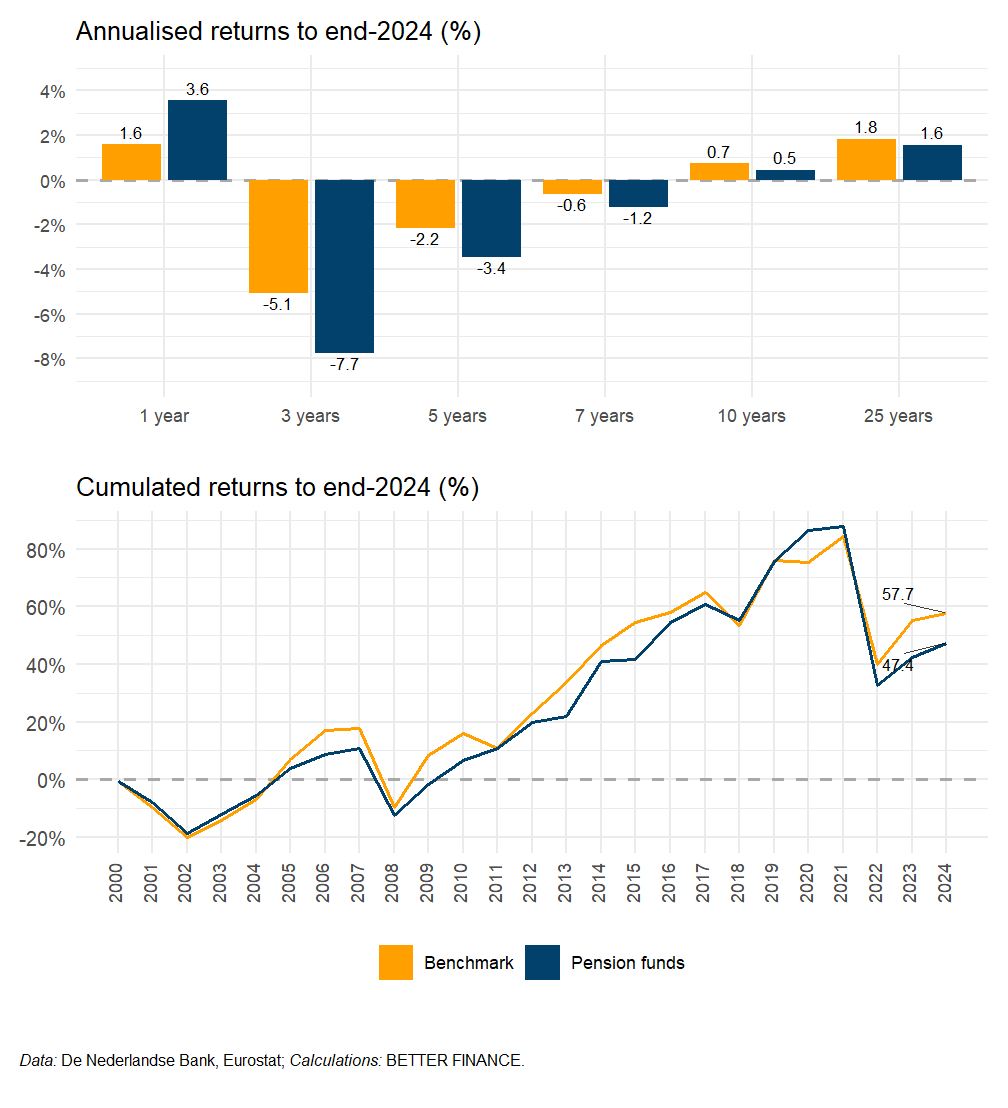
As shown in Figure 13.8, pension funds’ average real net returns fail to beat the benchmark’s returns for all holding periods except the year 2024, where pension funds’ outperform our benchmark by 2 p.p.s. Over 25 years, the difference is a 0.2 p.p. underperformance for pension funds. However, the reader must bear in mind the fact that the limited data availability up to 2015 mean that our calculations most probably overestimate the long-term returns of Dutch pension funds. The gap between pension funds and the benchmark may be somewhat wider than Figure 13.8 shows. Regardless of the extent of overestimation, we can safely say that Dutch pension funds’ returns fail to beat a rather conservative capital market benchmark.
13.6 Conclusions
Dutch pension funds’ average performance reflects a relatively conservative investment mix that makes for a steady path of capital accumulation. However, after accounting for costs and, crucially, inflation, the additional retirement capital generated by pension funds’ investment remains limited.
The efforts that Dutch pension funds have made to account for costs and report these costs in a uniform manner enable us to testify of a trend towards lower costs of managing Dutch occupational pensions. These efforts are welcome, as clear and comparable cost and performance information is essential to assess the management of pension funds and ensure the accountability of managers. That is the case even where enrolment is mandatory and choices available to the investor limited as in the current Dutch DB model, but becomes even more crucial where the risk of underperformance is borne by the members, in a DC model.
The DB model offered Dutch pension savers the guarantee of a given level of benefits, but insufficient returns still prevented the indexation of pension benefits, effectively letting participants exposed to the risk that inflation slowly eat away the purchasing power of these guaranteed benefits.
Moving to a DC model does shift the financial risk onto participants’ shoulders, but the ongoing WTP reform and the CDC model it will generalise across the Netherlands will be different from a pure DC model, as it will mutualise a large part of the risk across members. If that model enables pension fund managers to implement more aggressive investment strategies and generate higher returns for their participants collectively, it might actually result in more financial security for Dutch pension savers.
Like many observers across Europe, we will continue to follow the implementation of the Dutch reform with great interest over the coming years, in the hope of seeing increased returns for participants.
Acronyms
- AFM
- Autoriteit van Financiële Markten
- AOW
- Algemene Ouderdowswet
- AuM
- assets under management
- CDC
- collective defined contribution
- DB
- Defined benefits
- DC
- Defined contributions
- DNB
- De Nederlandse Bank
- EET
- Exempt Exempt Taxed
- EU
- European Union
- NCA
- national competent authority
- PAYG
- pay-as-you-go
- PPP
- personal pension product
- SVB
- Sociale Verzekeringsbank
- WTP
- Wet Toekomst Pensioenen
- p.p.
- percentage point
That is, an individual who has lived in the Netherlands during the whole period—66-16 = 50 years—would be entitled to \(50\times2\% = 100\%\) of the maximum monthly allowance.↩︎
Eurostat data, the old-age dependency ratio is the ratio of number of pensioners to the active population. The EU-27 average was 34.4% in 2025 and is projected to rise to 50.4% by 2050.↩︎
The Sociale Verzekeringsbank (SVB), the institutions that pays-out social benefits in the Netherlands, provides a table with retirement ages by age cohort, for birth dates between June 1st, 1956 and December 31st, 2000. These projections are bound to be indicative only, as life-expectancy projections are to be refined over time.↩︎
There are rare cases of individuals in the Netherlands whose professions or companies do not entail enrolment into an occupational pension scheme, e.g., entrepreneurs.}↩︎
The system is explained in the DNB’s website↩︎
In all fairness, we must say that this information would be available in the annual report of each pension fund, but collecting information from so many and varied sources is beyond our possibilities.↩︎
In the World Bank’s conceptual framework on pensions, that would be the “fourth pillar” of a pension system (World Bank 2008). However, that “fourth pillar” is a somewhat of a catch-all category for assets that can be accumulated for the purpose of providing income in retirement, including but not limited to financial assets. Admittedly, many life insurance contracts are closer to PPPs than to many assets that would be categorised as “Pillar IV”.↩︎
See more information on the site of the Dutch tax administration, belastingdienst.nl.↩︎
The difference only applies to the first income tax bracket: beyond EUR {41 123}, tax rates are the same for younger and older taxpayers. Income tax rates and brackert are available on the website of the Dutch Tax Authority.↩︎
Since data for this cost item is only available since 2015, we do not have sufficient data to extrapolate for early years.↩︎